Geographic
Representation
& Speculation
Three exercises and two final projects exploring how data visualization and spatial mapping can reveal hidden patterns — in marine ecosystems, urban sound, and the global consequences of armed conflict.
Course
SCI 6322 Mapping · Spring 2018
Advisor
Robert Pietrusko
Team
Boxiang Yu · Yinan Liu · Shuo Zhao
Year
05 / 2018
Full documentation · Vimeo · 4:19
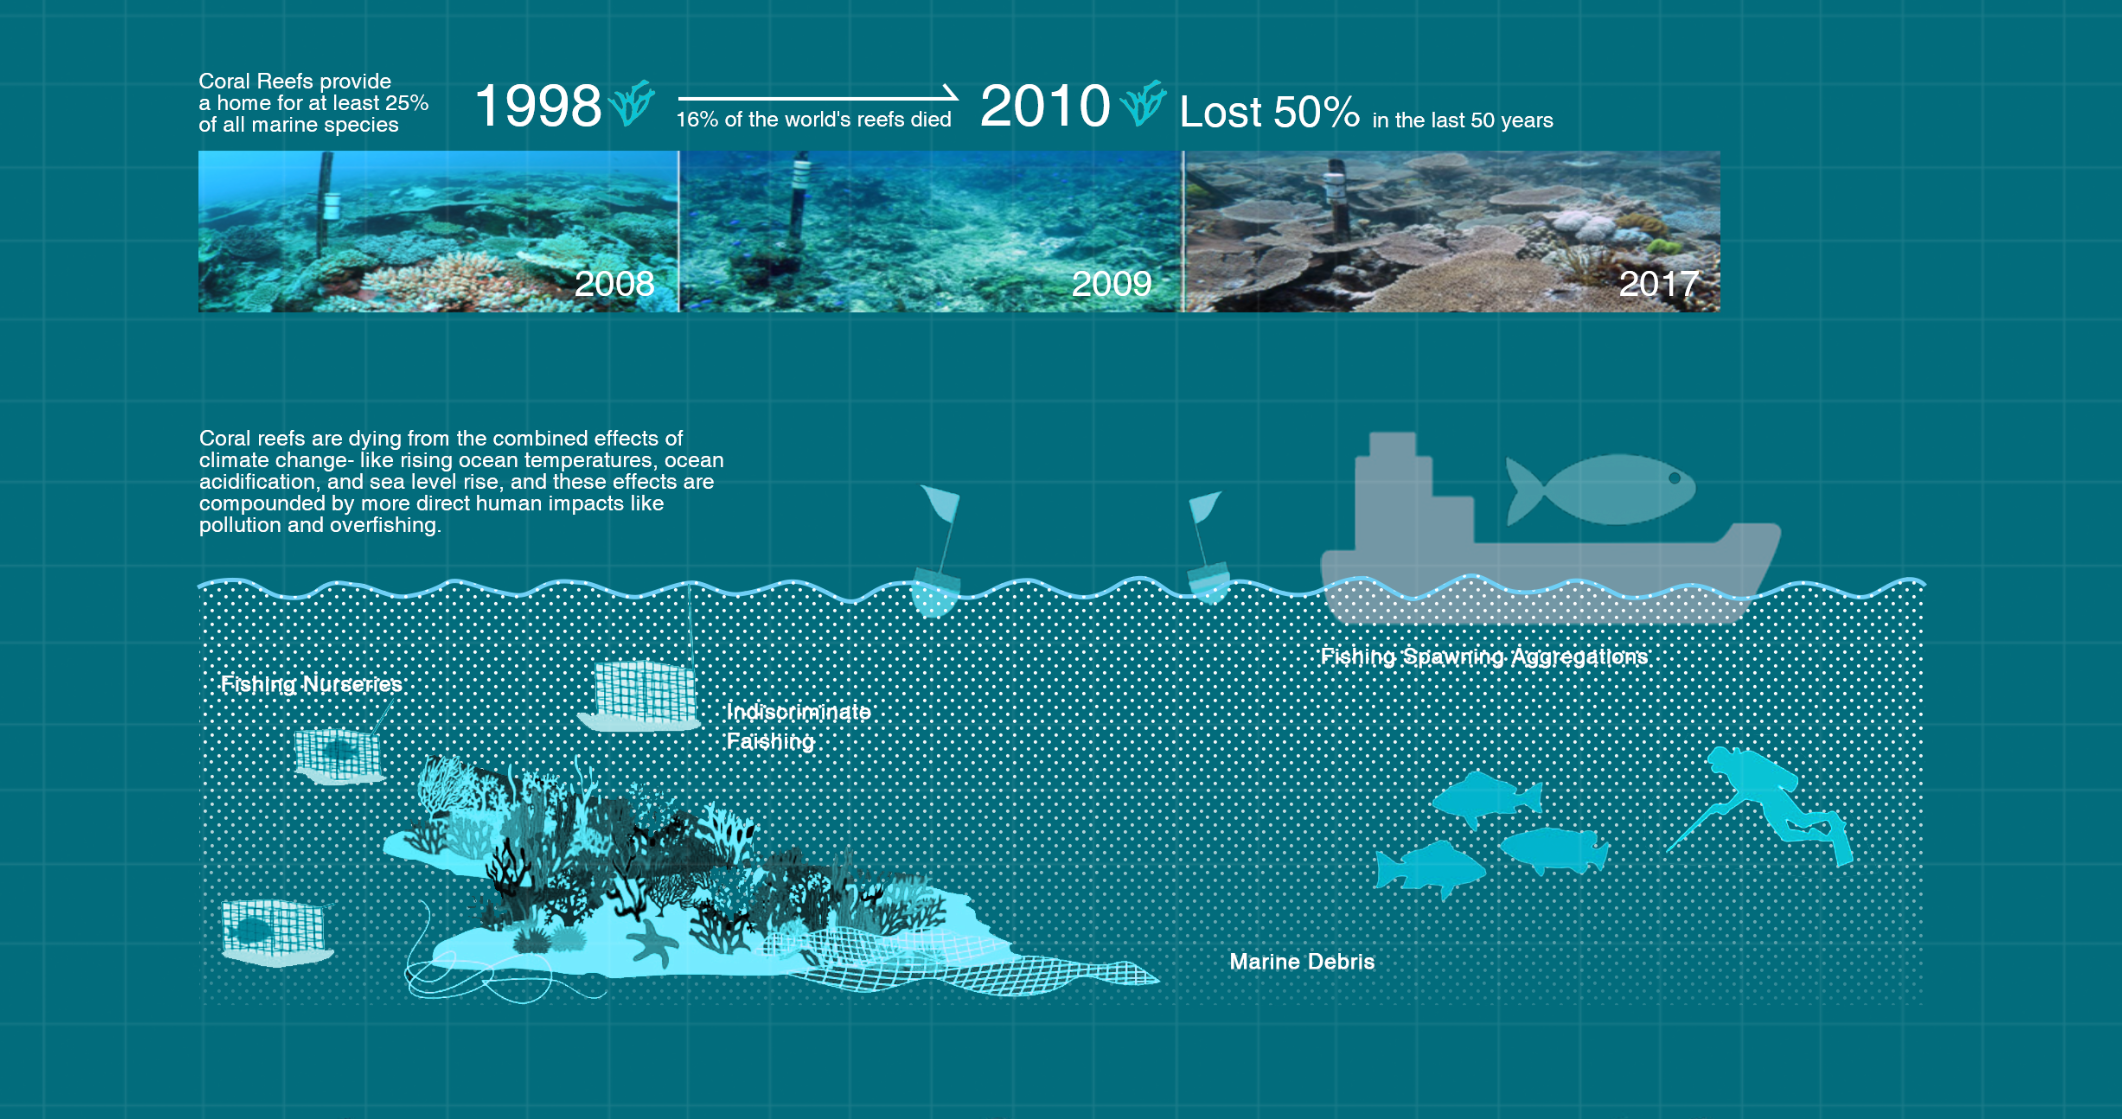
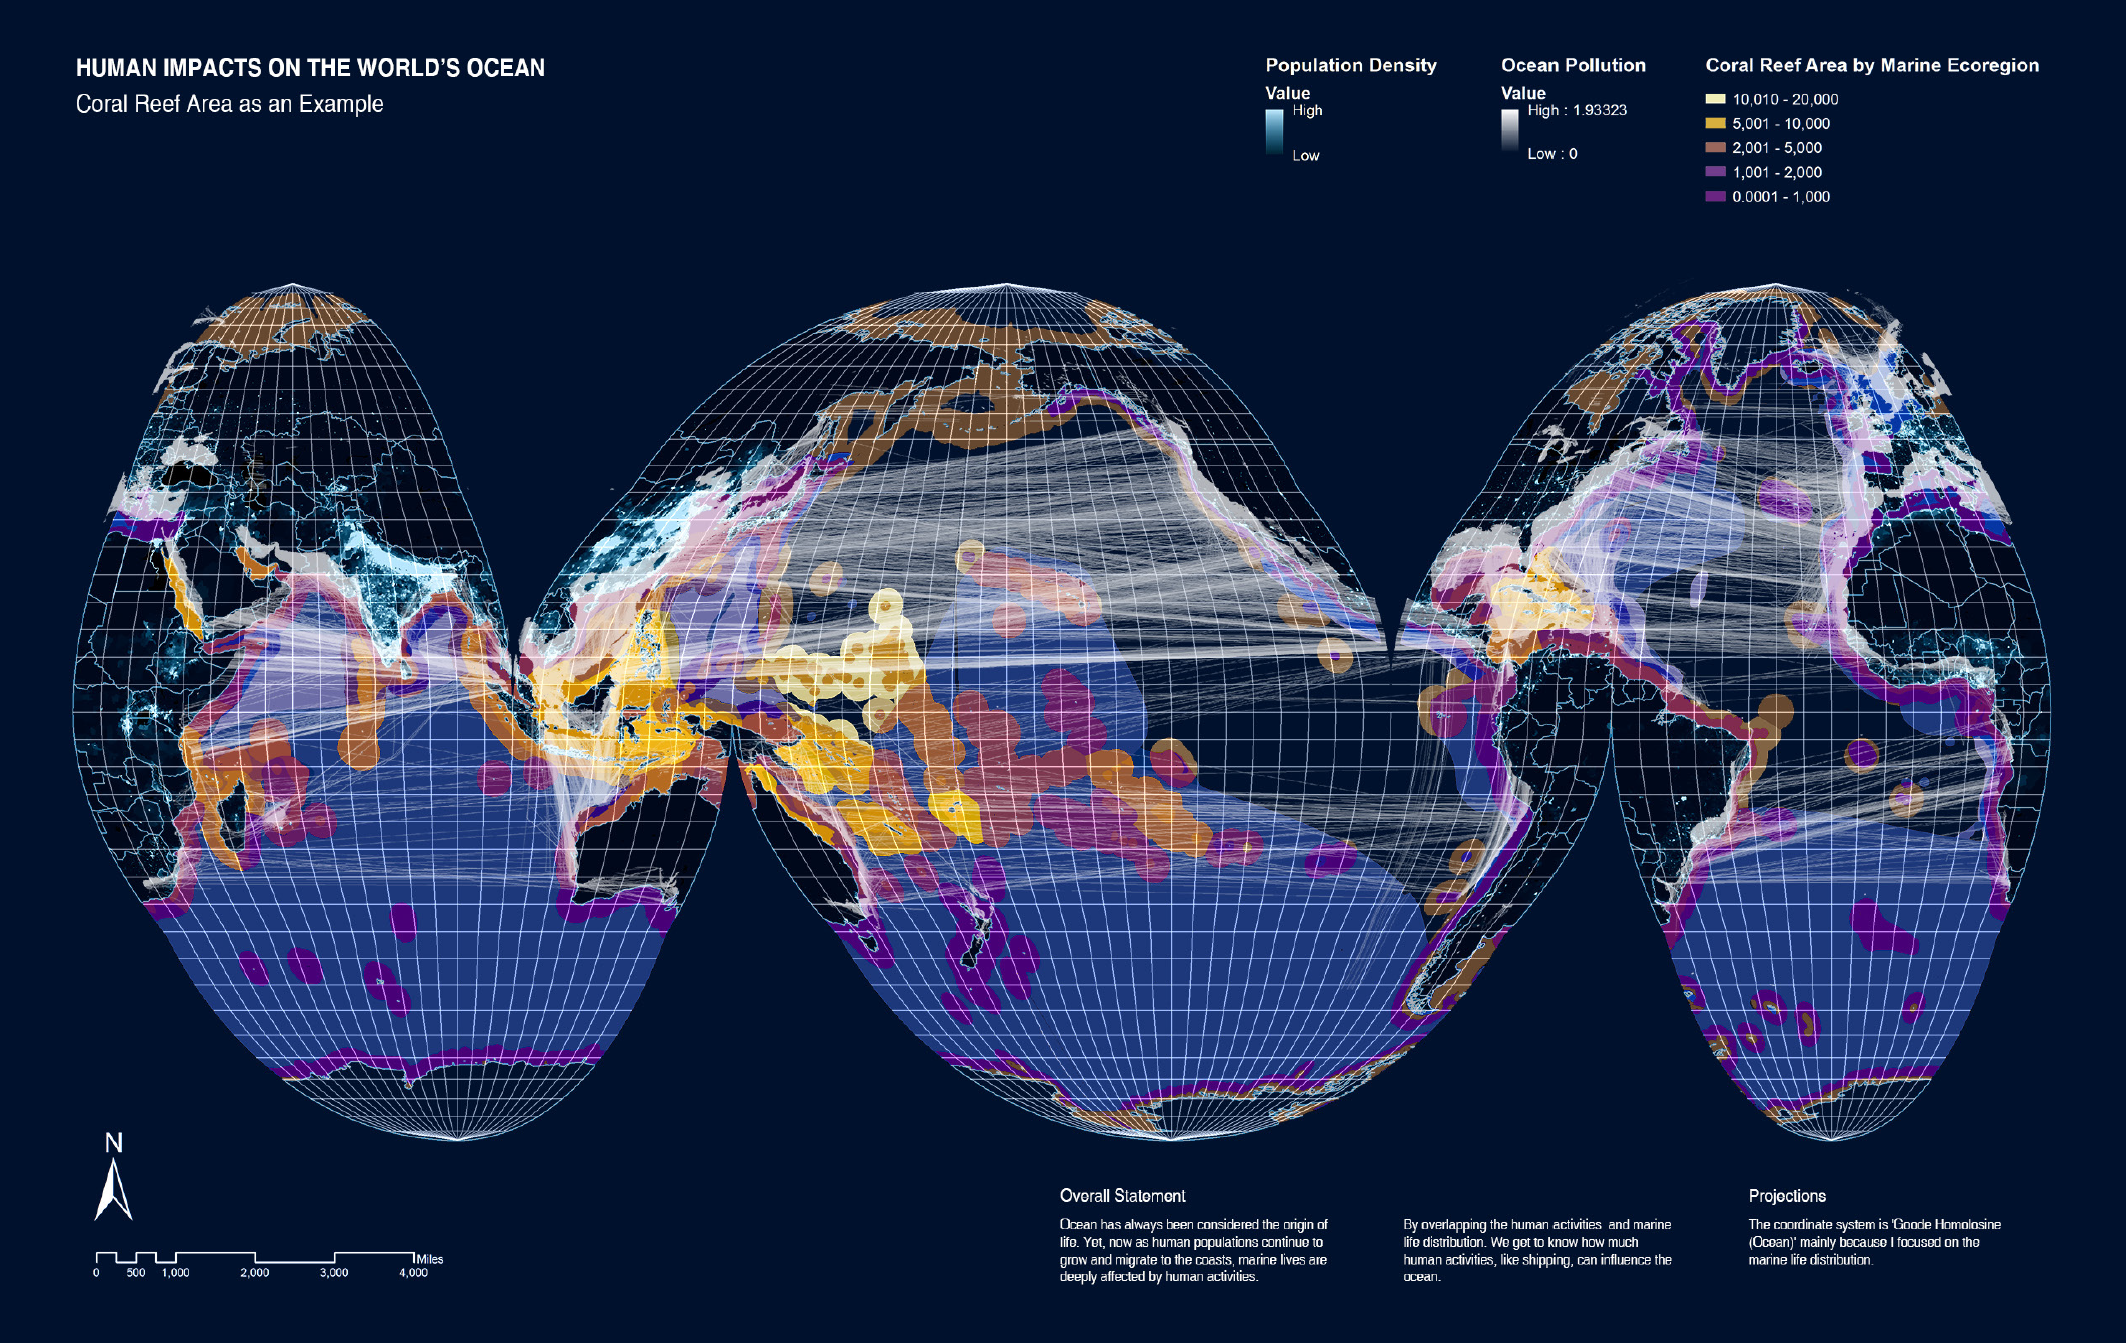
Human Impacts
on Coral Reefs
Ocean covers over 70% of our planet. By overlapping human activities with marine life distribution, we quantify how shipping, pollution, rising temperatures, acidification, and sea level rise affect ocean ecosystems.
Coordinate system: Goode Homolosine (Ocean) — chosen to prioritize accurate representation of marine life distribution.
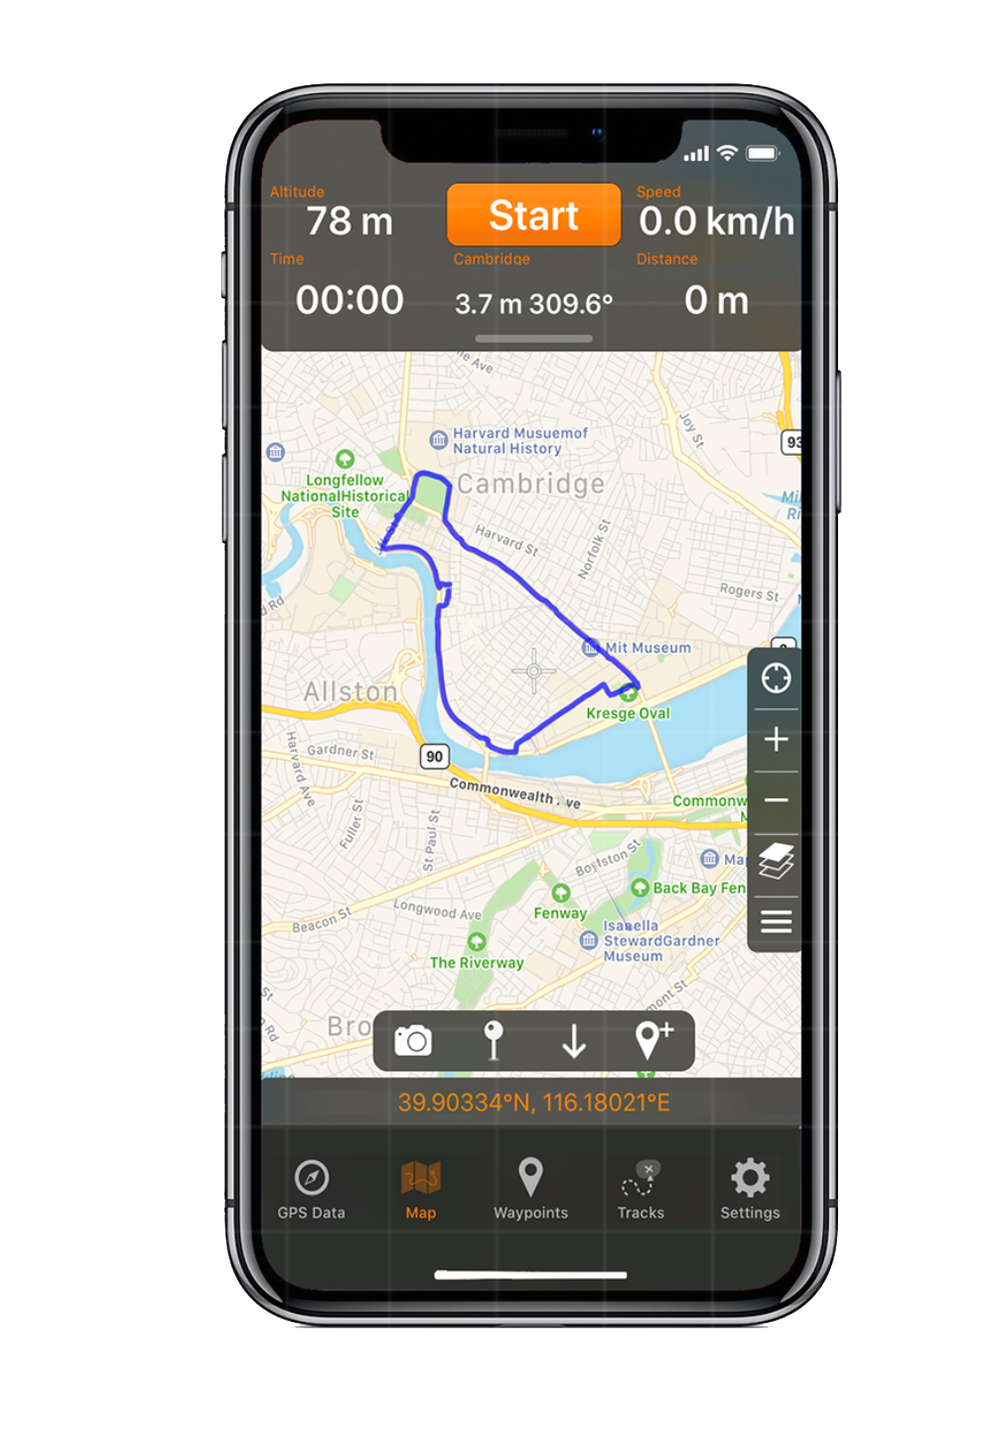
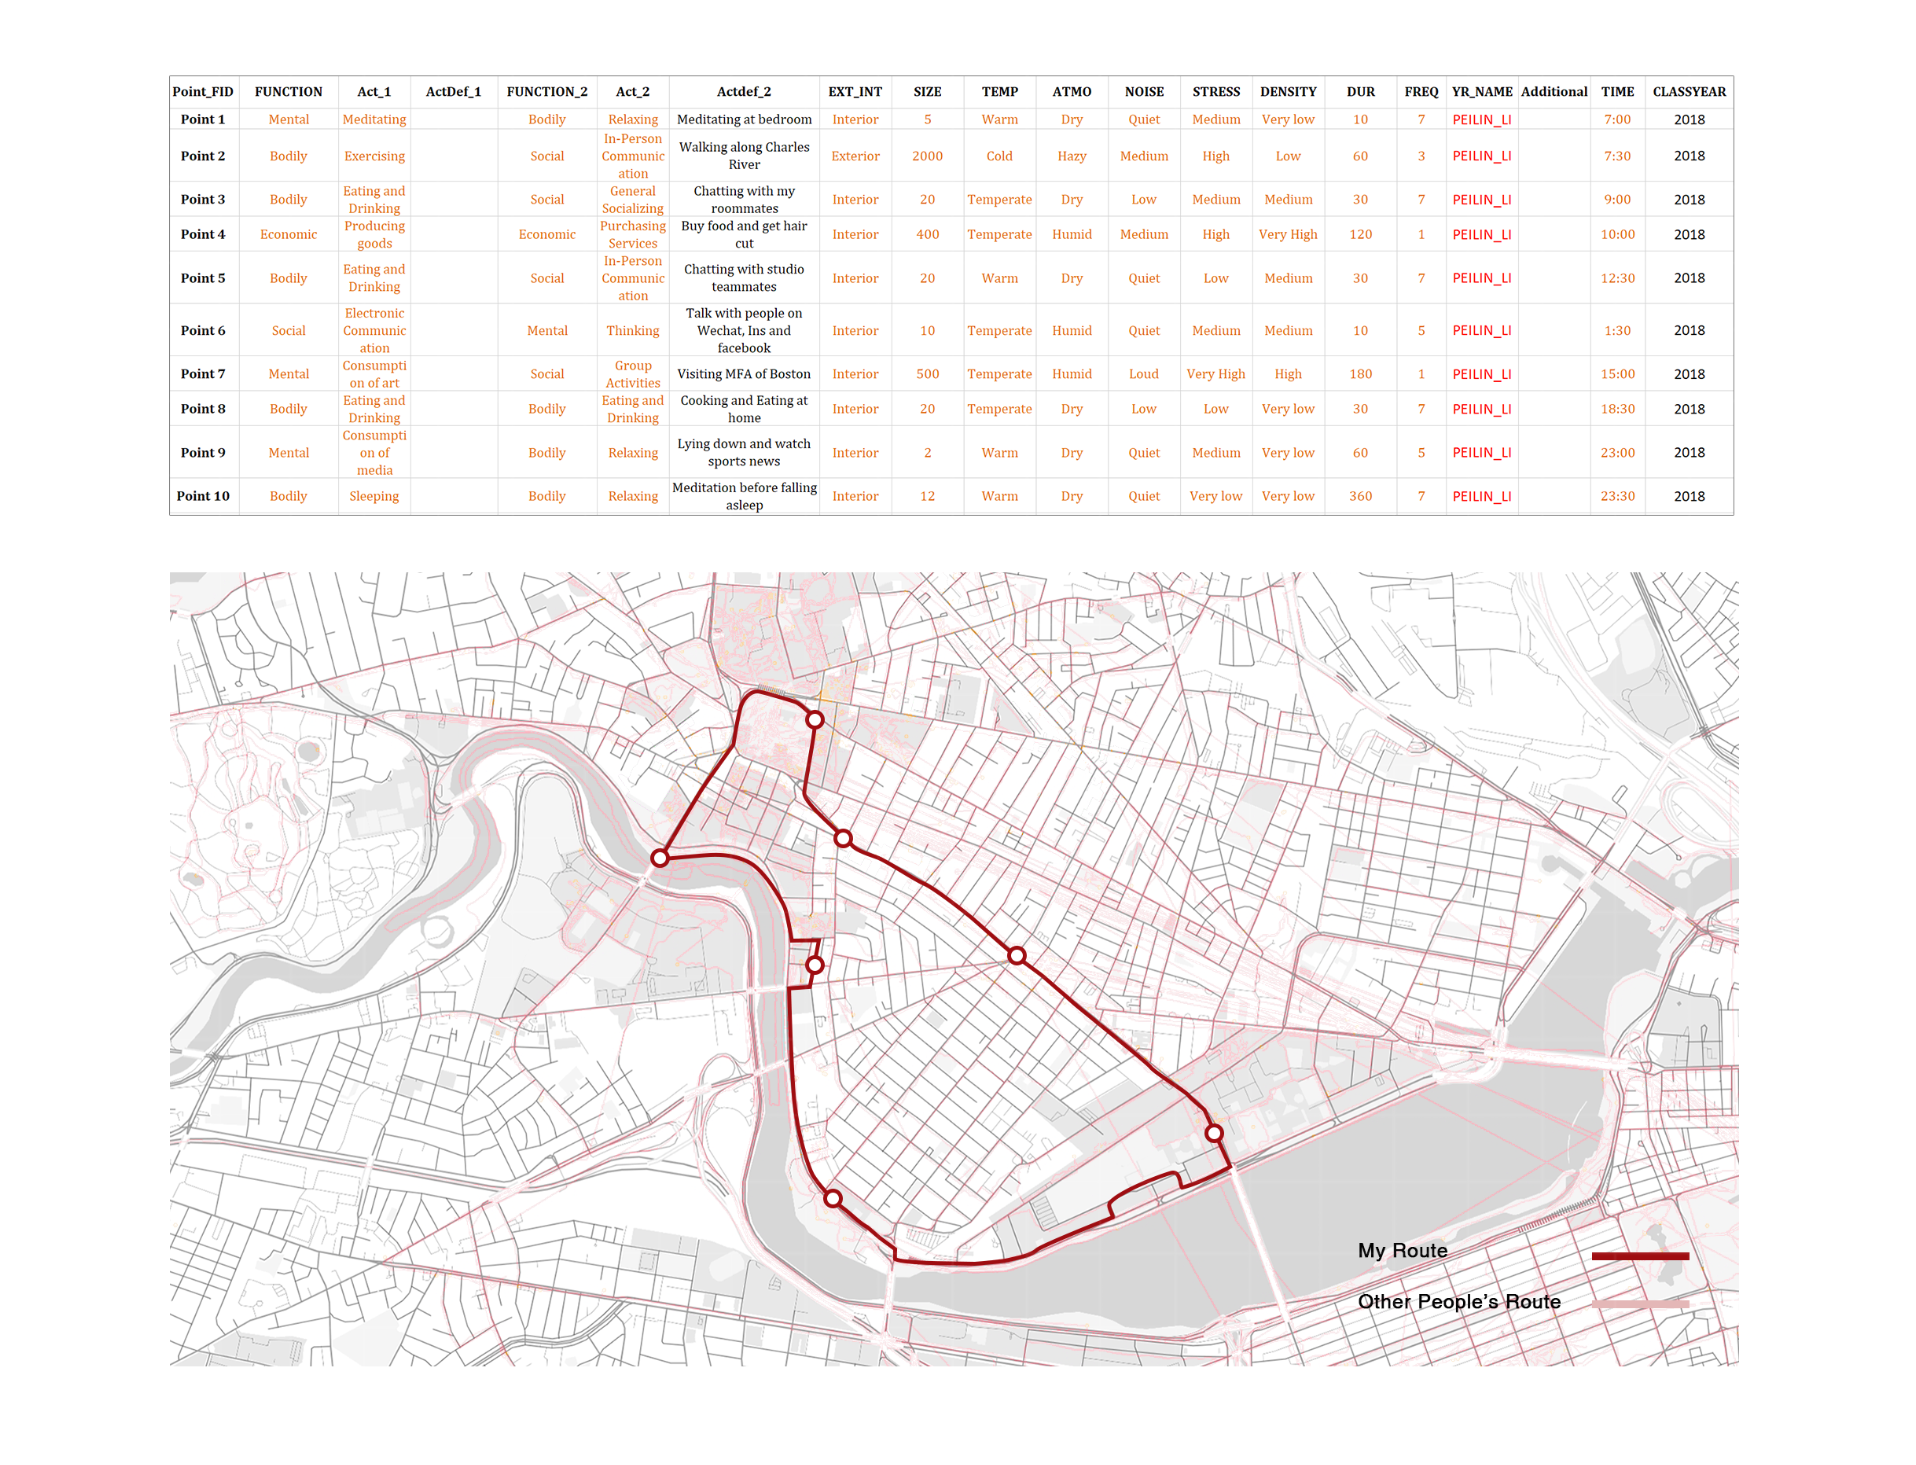
Daily Behaviors
with Urban Spaces
This exercise establishes the relationship between daily behaviors and urban spaces, classifying spaces by category and magnitude based on behavioral data.
We identified behavior trajectories and key spatial nodes, then recorded behaviors divided into personal, social, mental, and bodily attributes.
By synthesizing behavior data against space characteristics — temperature, noise, humidity, density — we draw conclusions about the relationship between human activity and urban form.
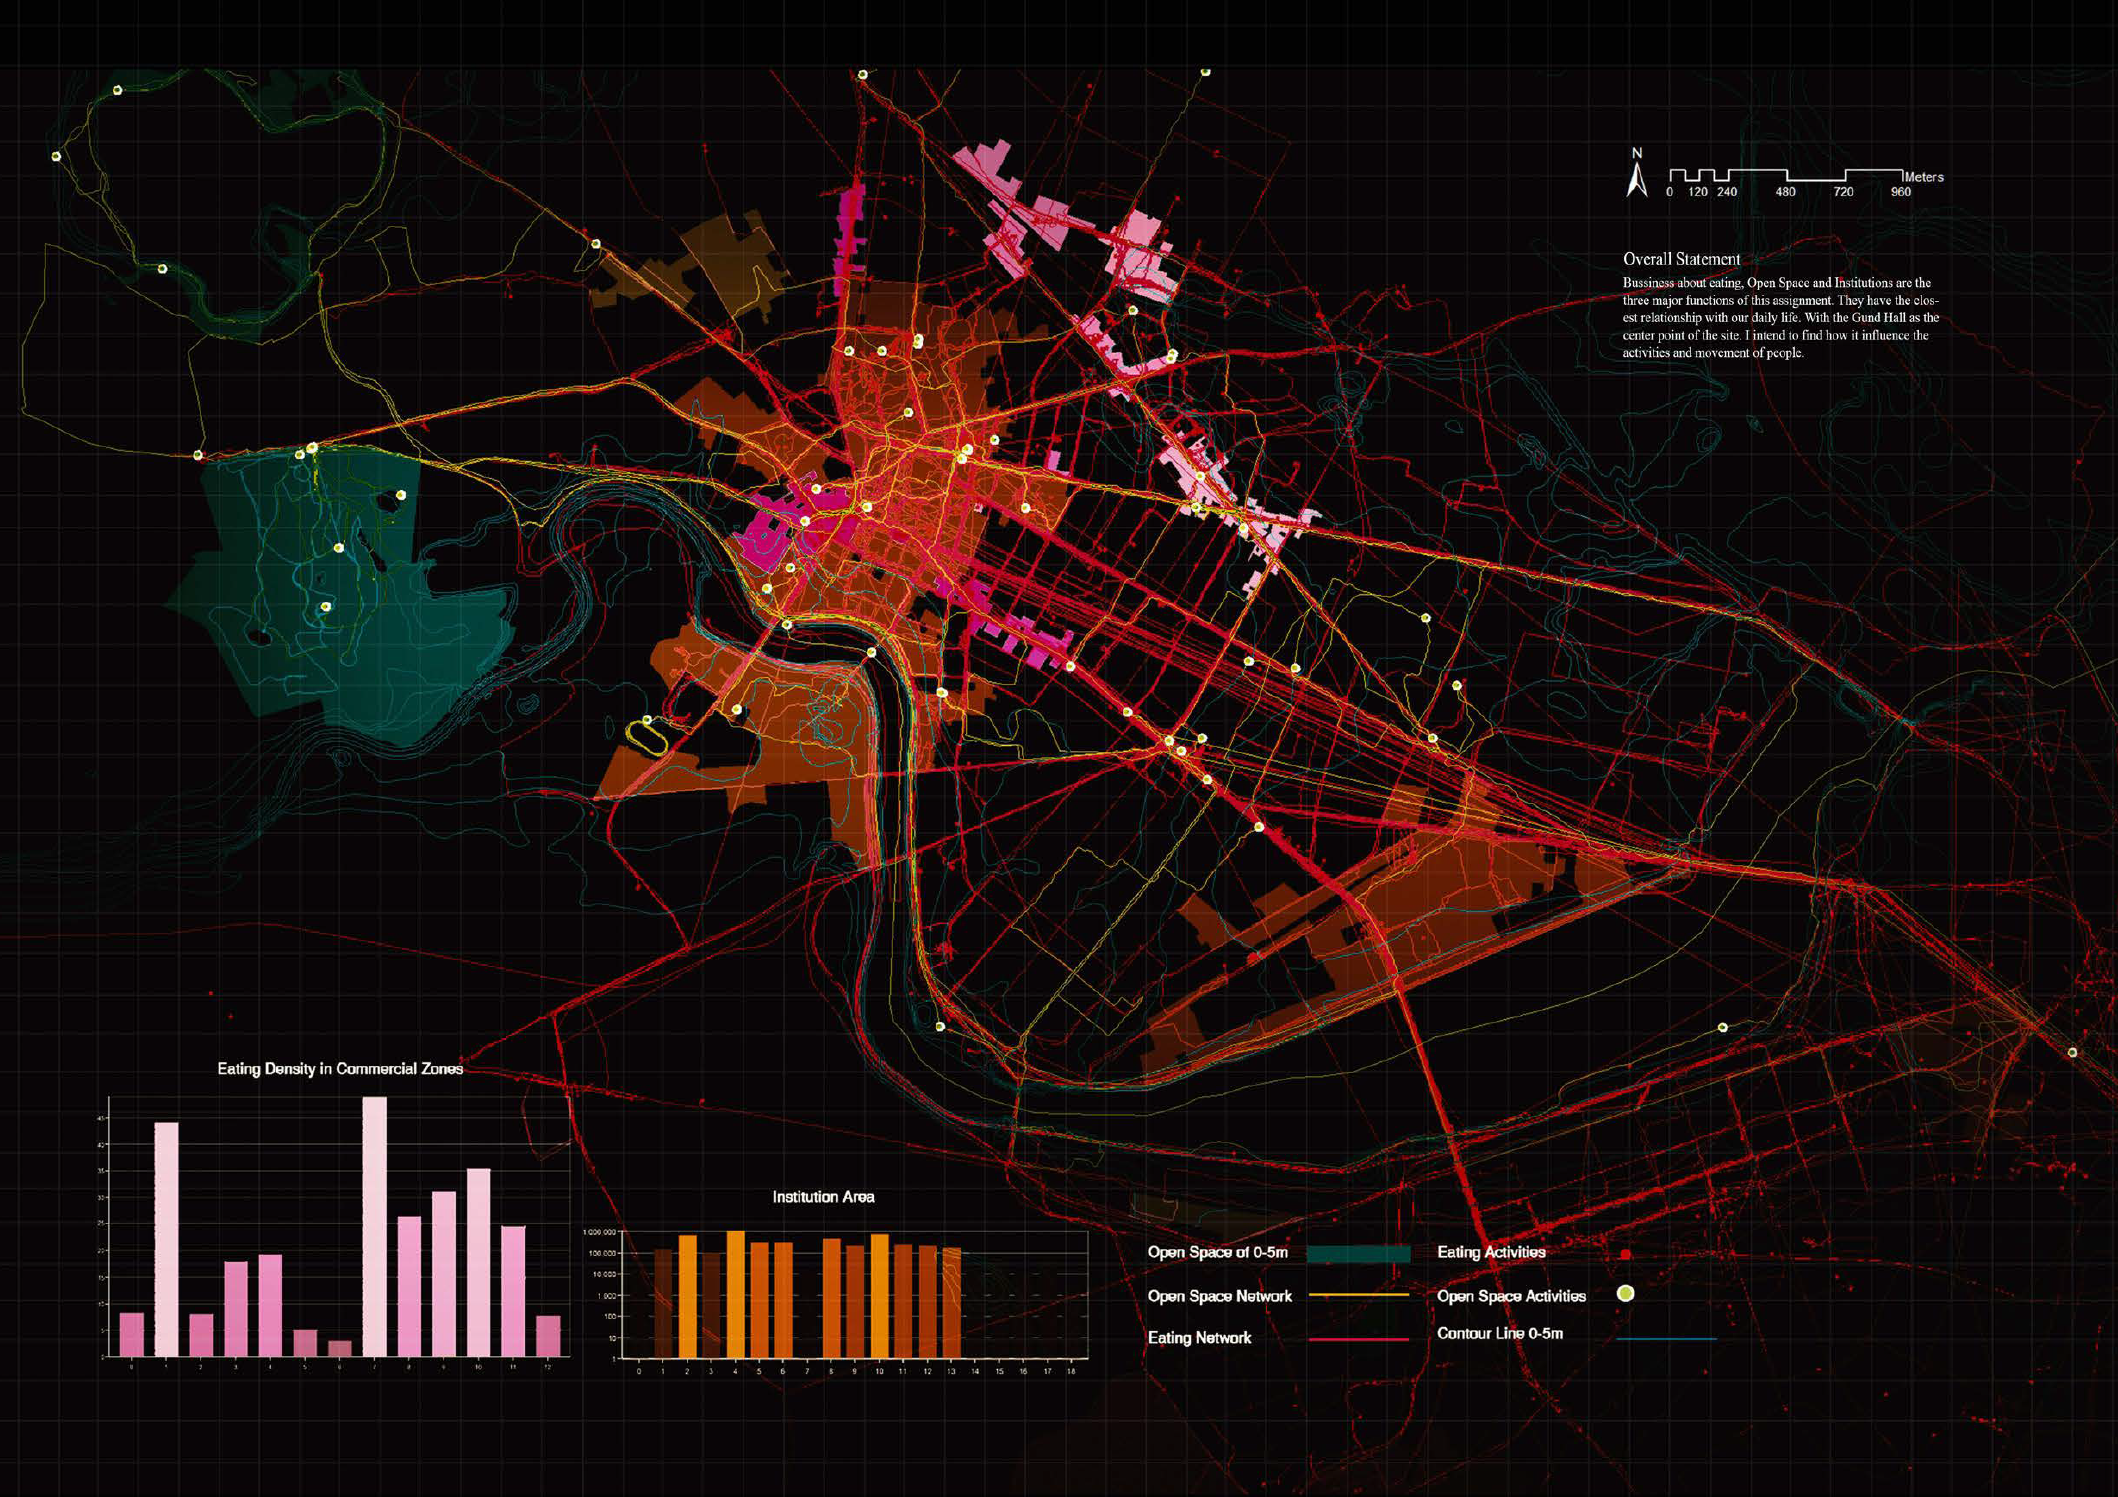
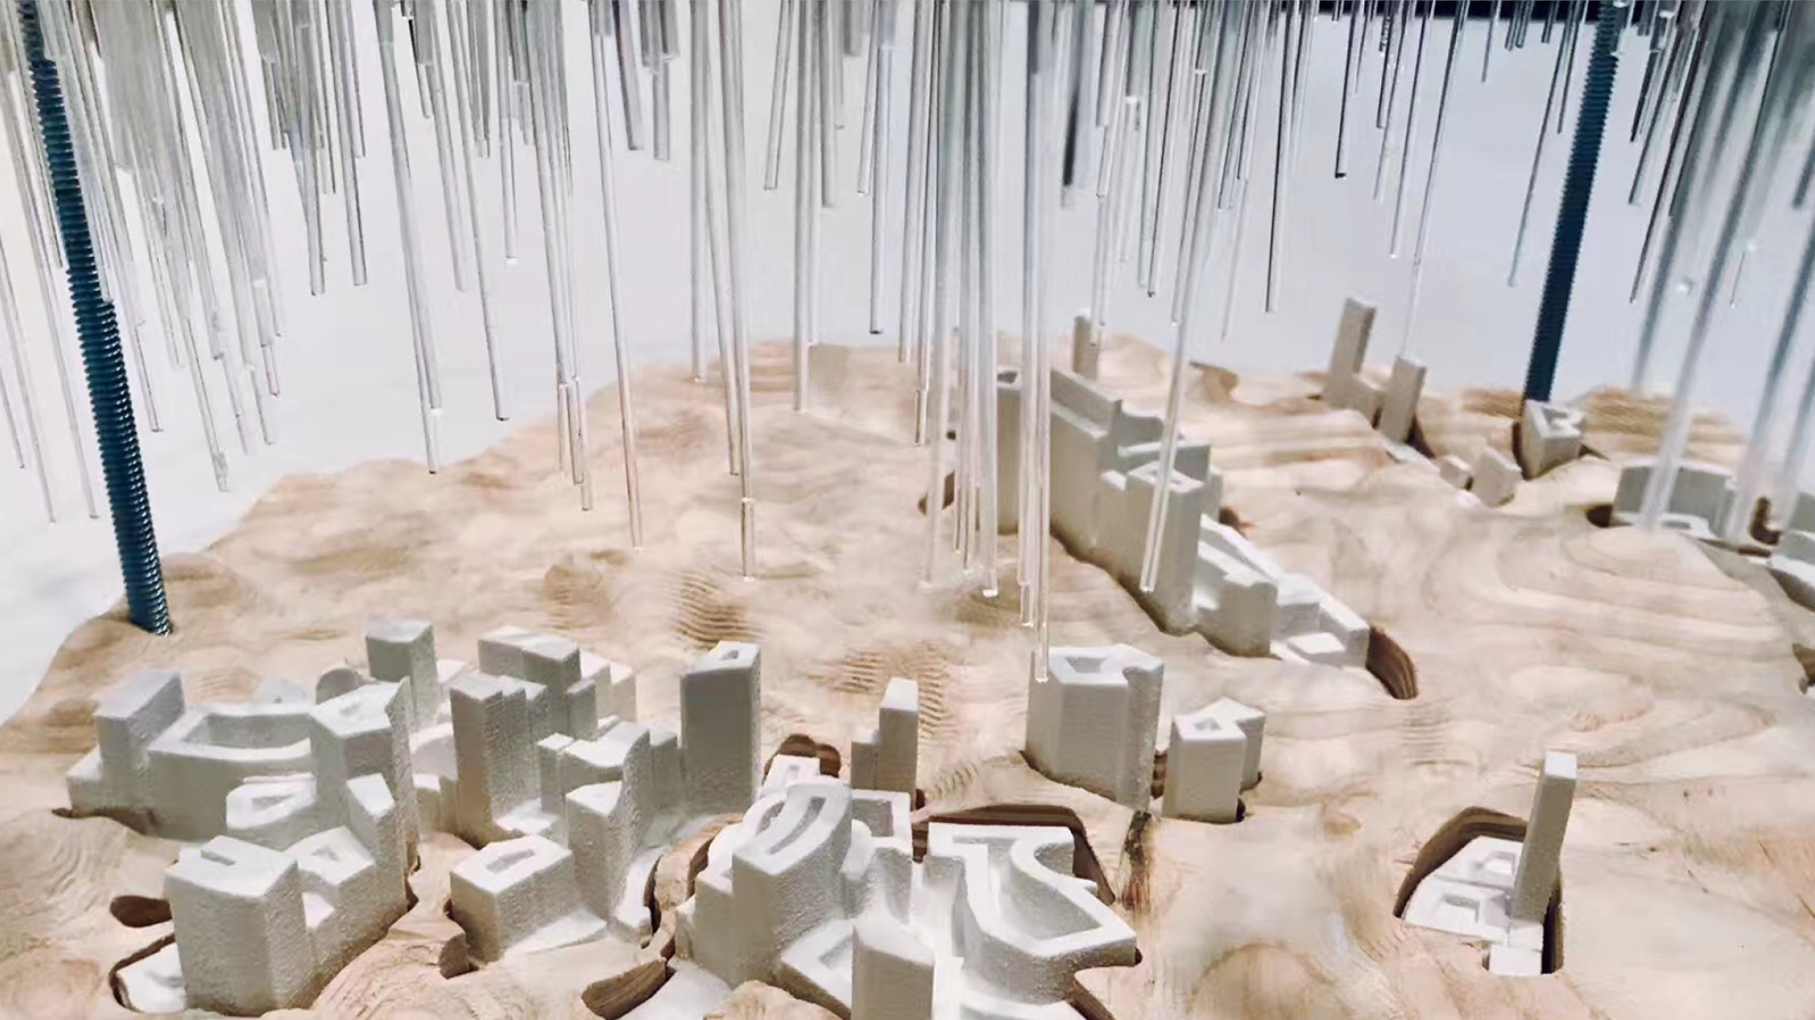
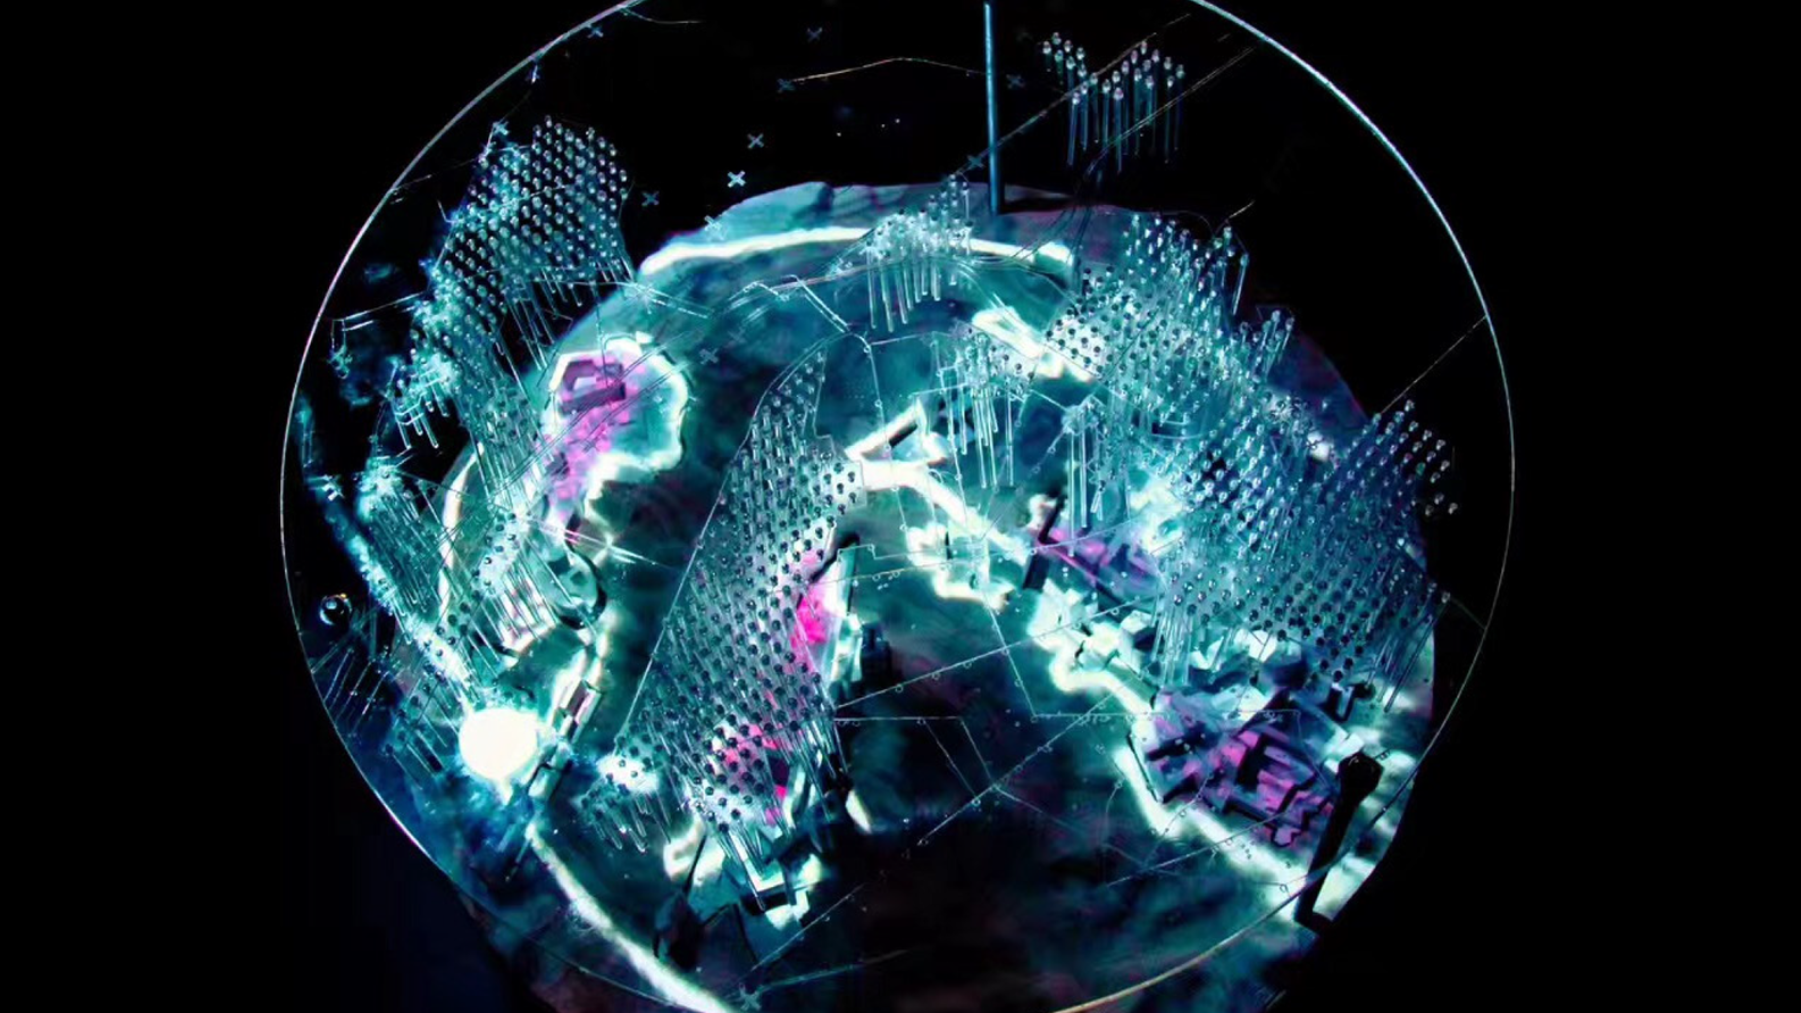
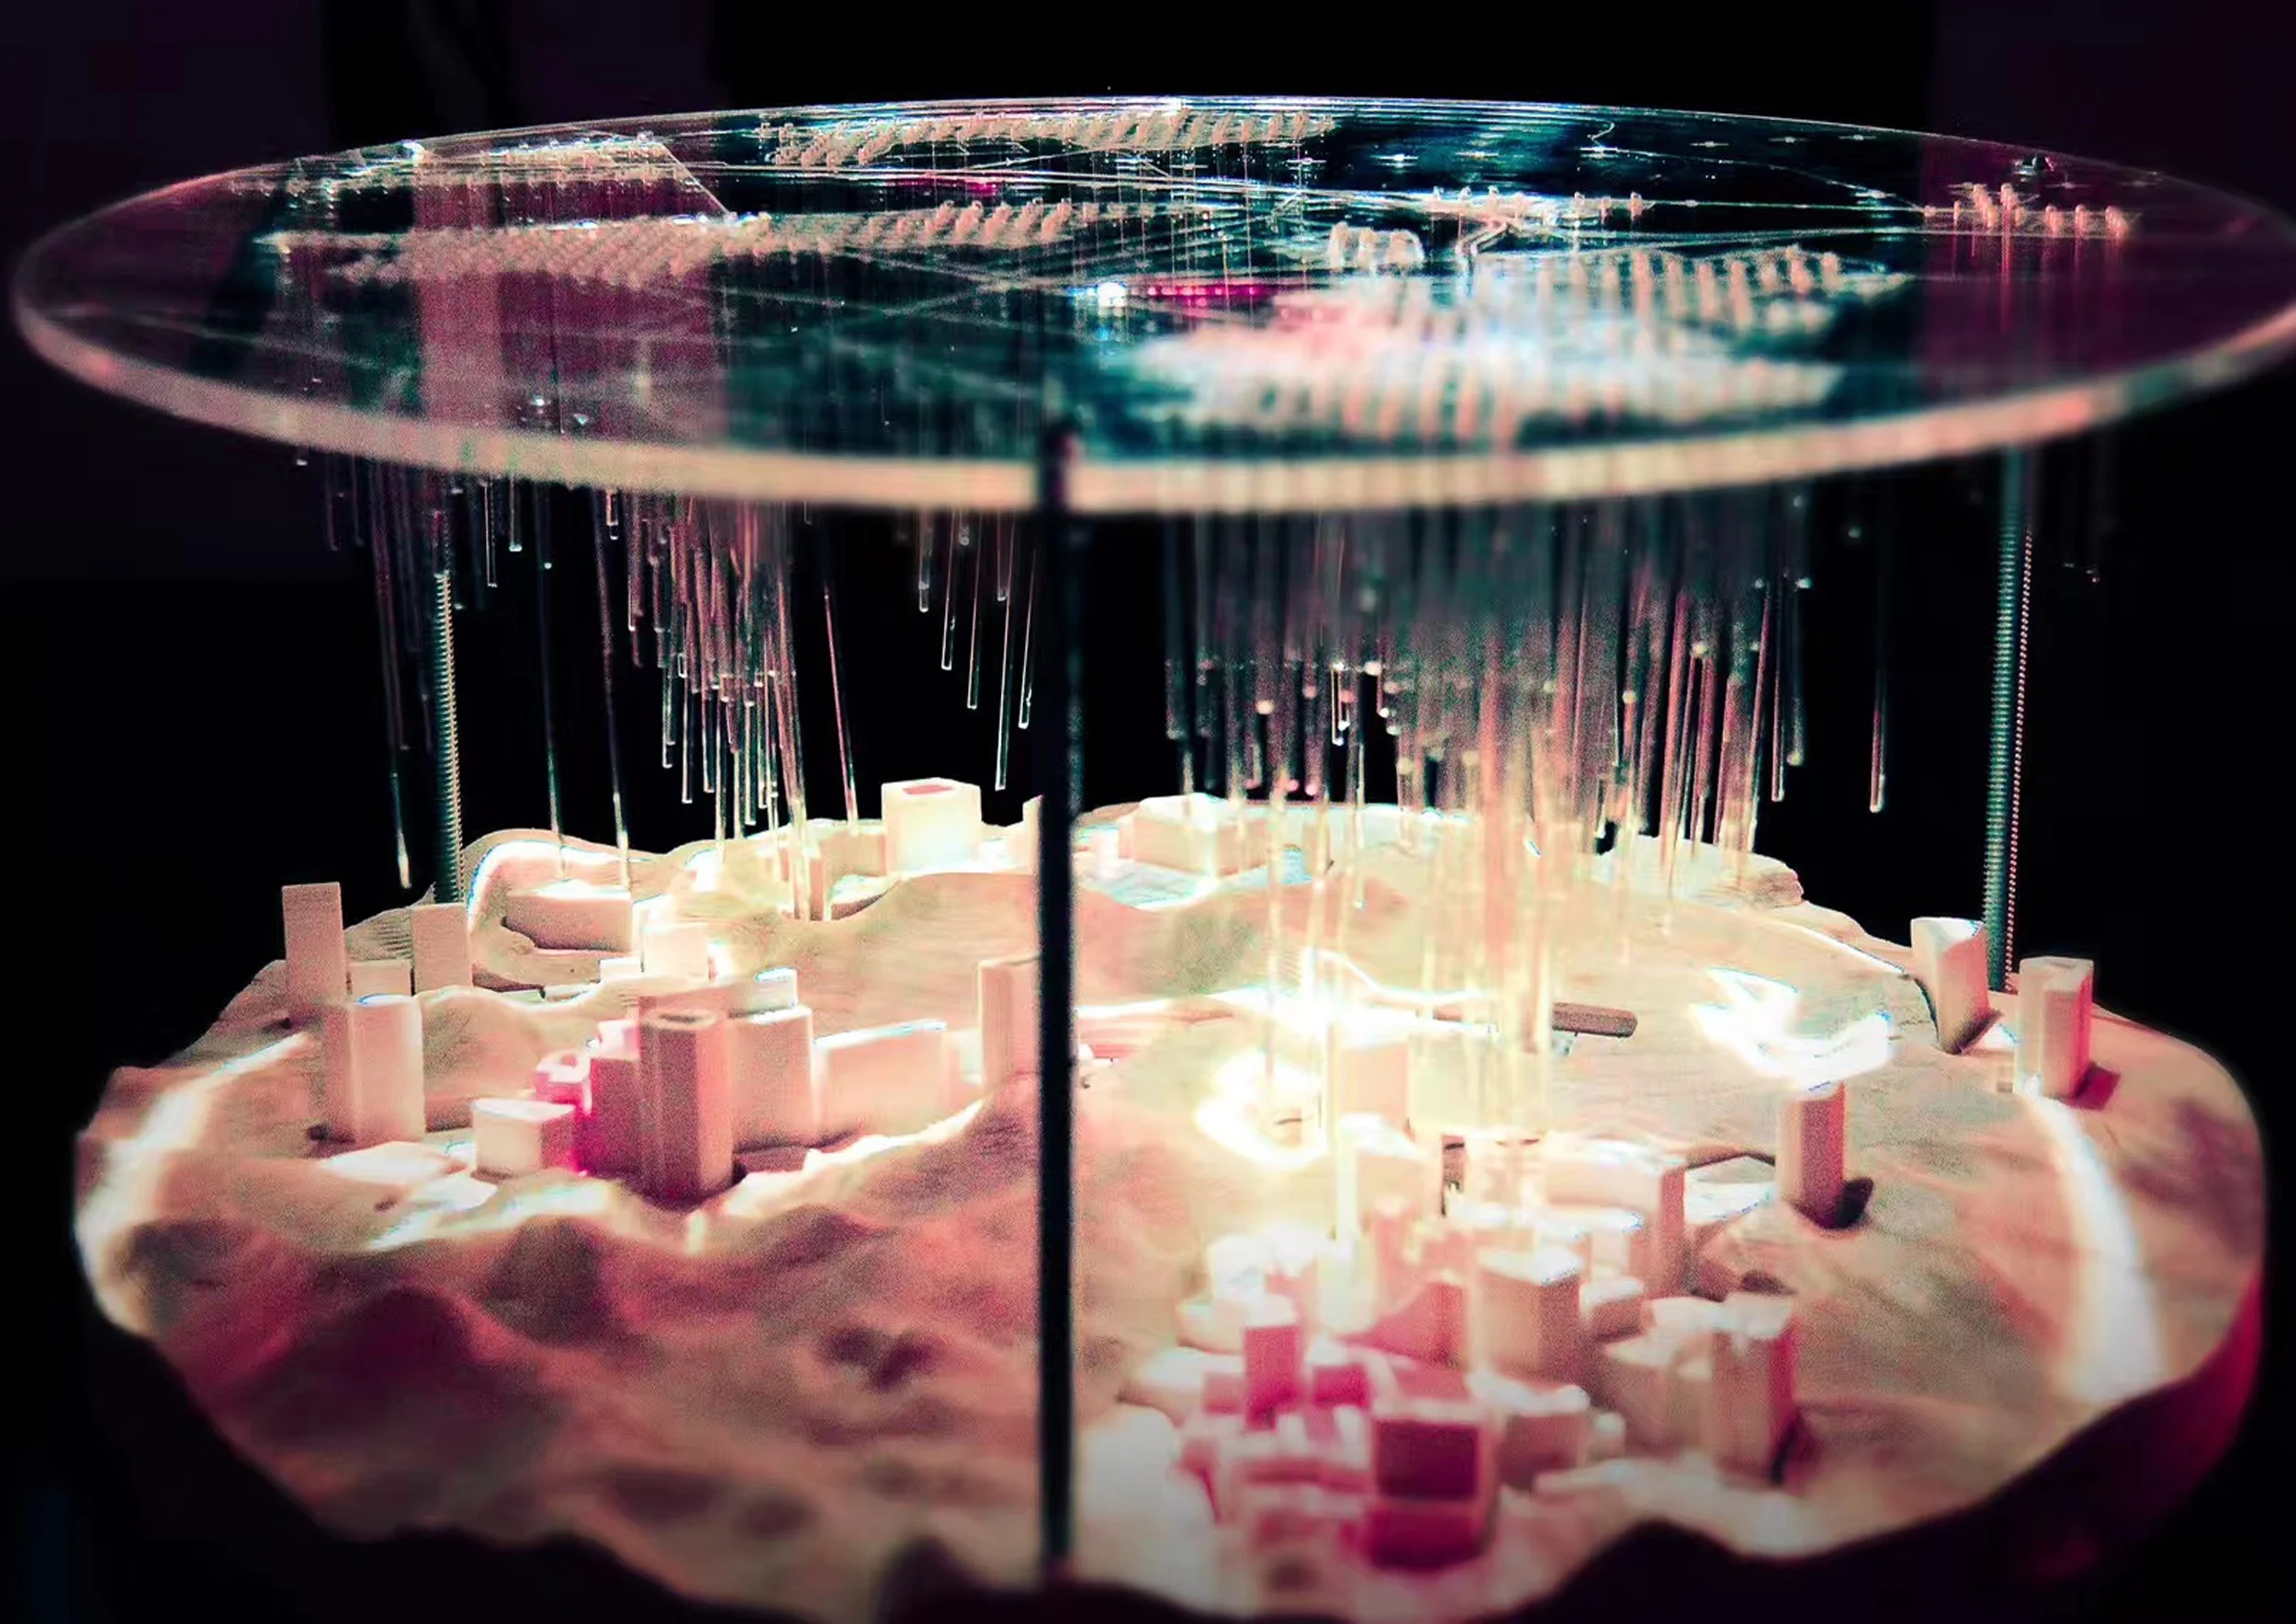
VOXSCAPE
Imagine a world built out of ambiance noises: the ground surface is shaped by general audio topography; building heights are generated by street unpitched sound volume; the clouds above are clusters formed by voice frequency.
This project studies vocality inside the cityscape and how it relates to materiality and spatial organization — regarding vocal patterns as a potential natural order to structure the urbanscape.
Transparent Plexi (sky) · 3D Printed Powder (terrain)
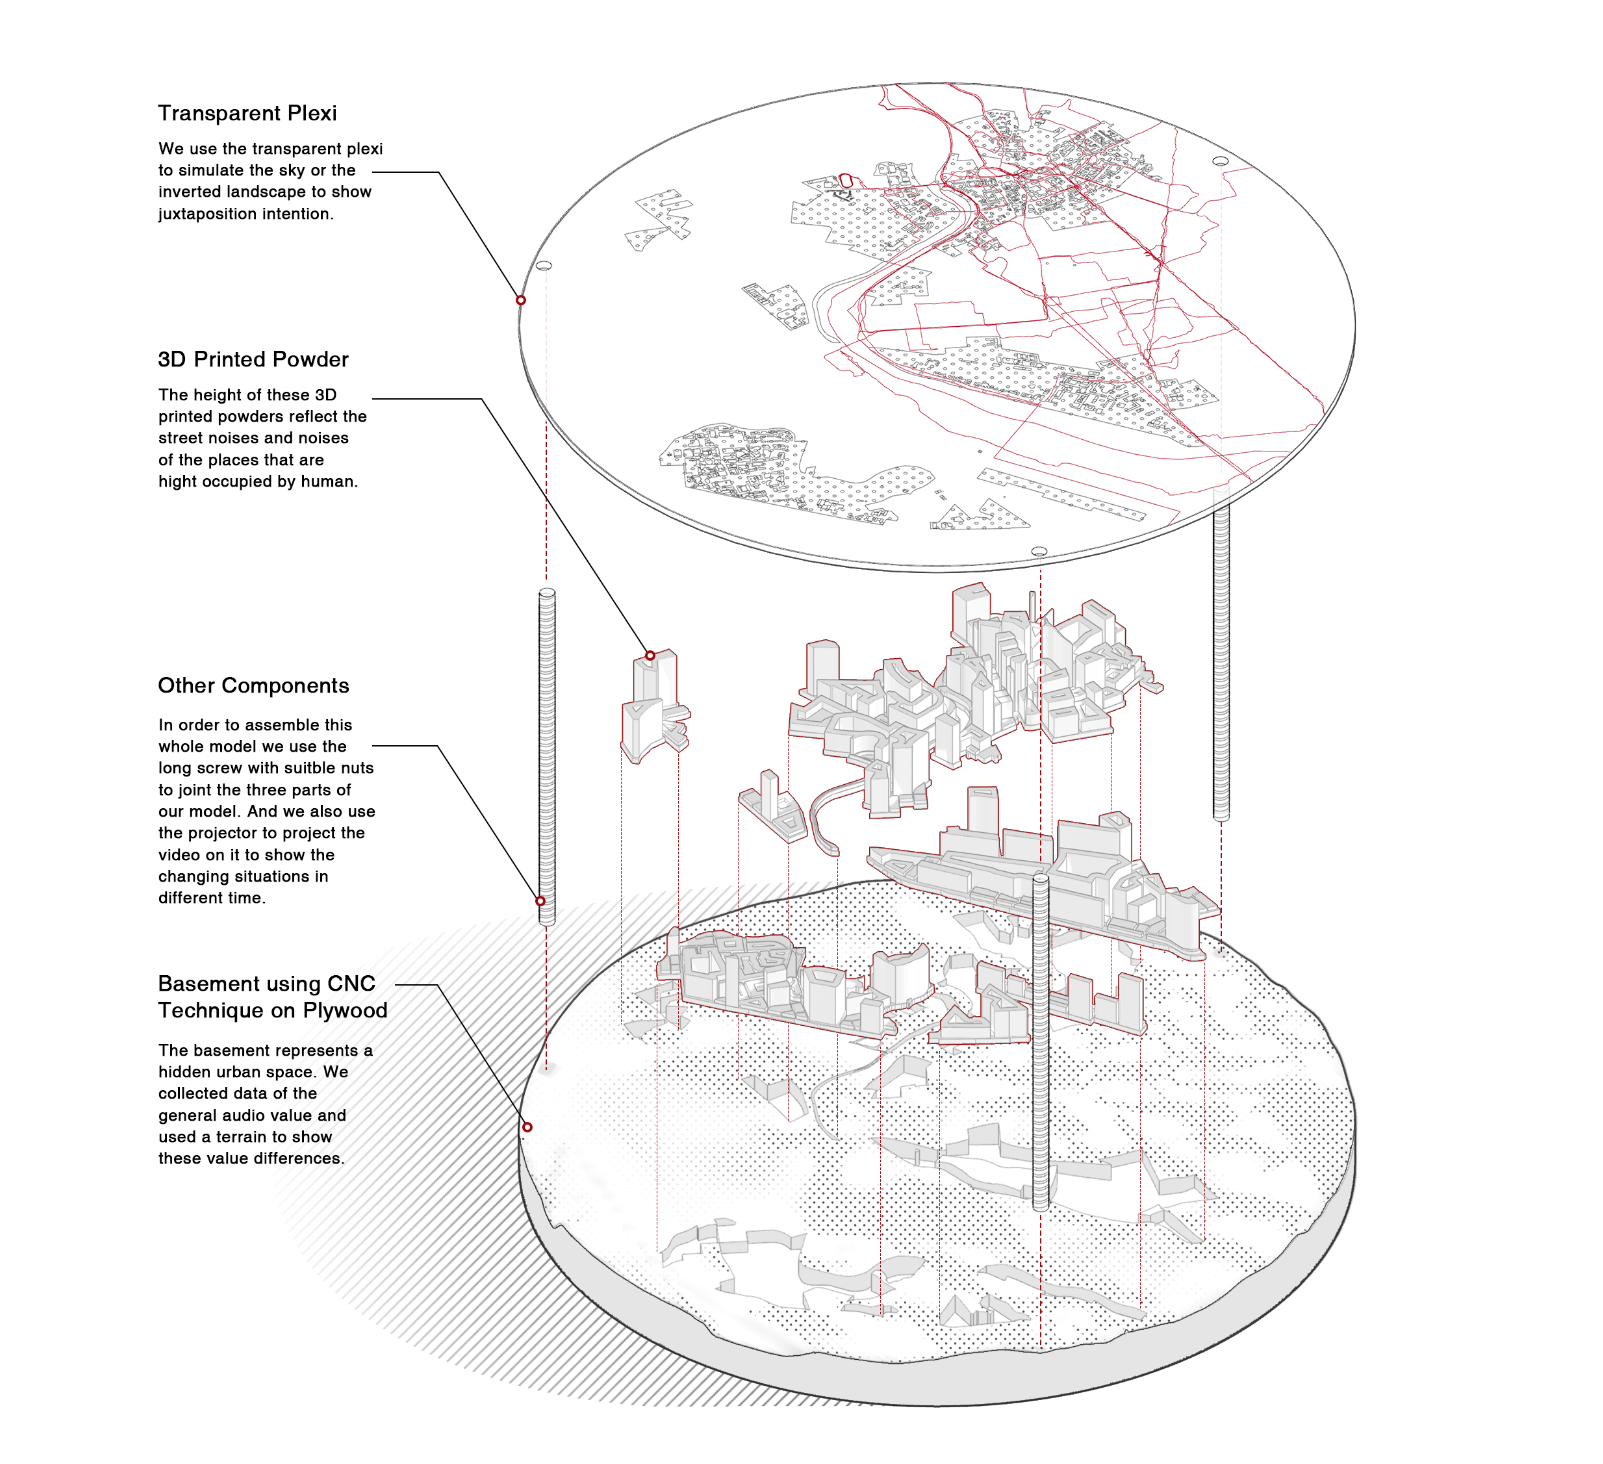
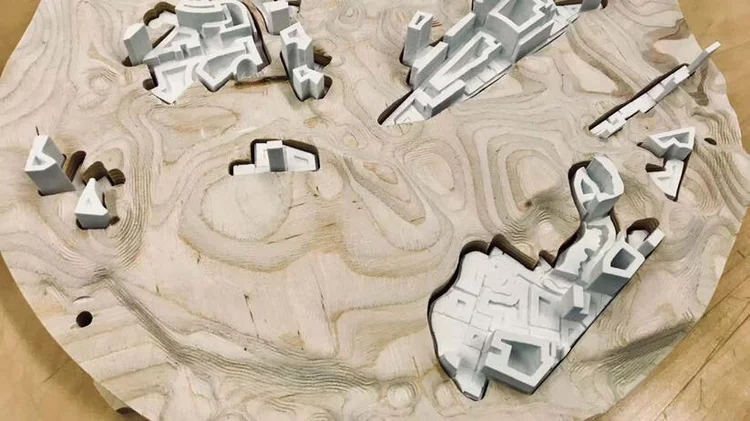

Physical model — transparent plexi sky layer · 3D printed powder terrain
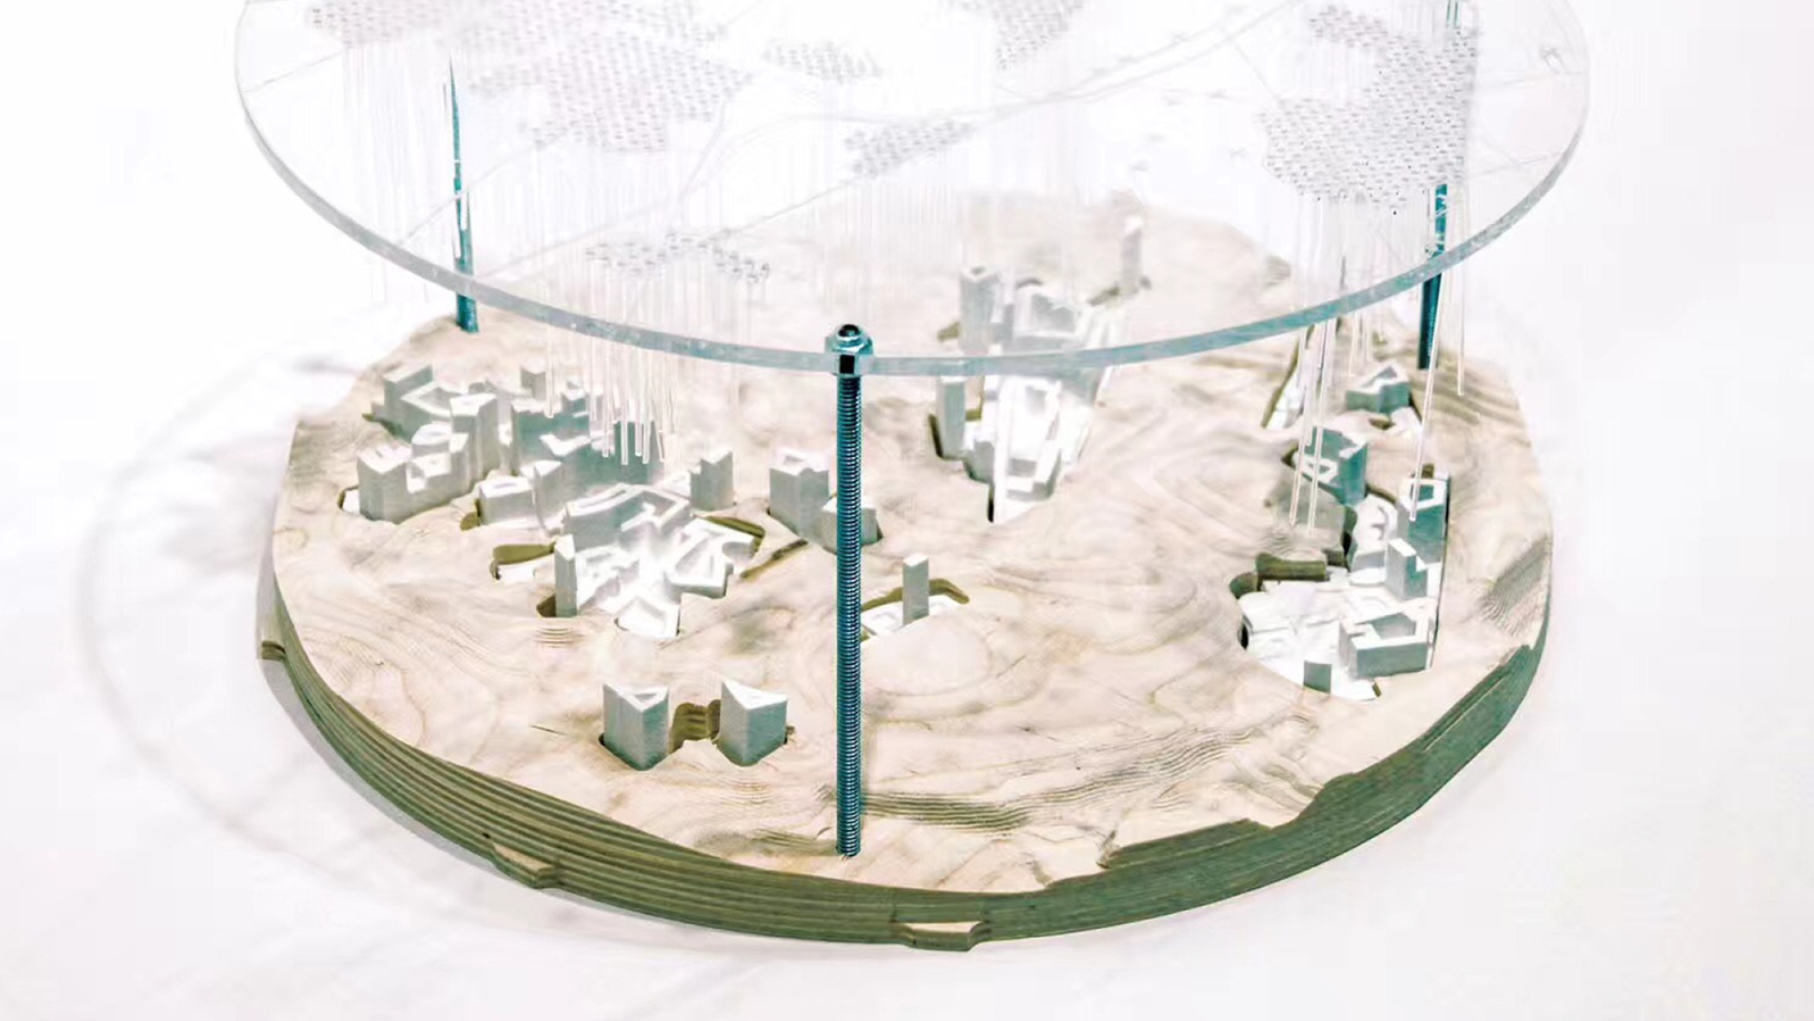
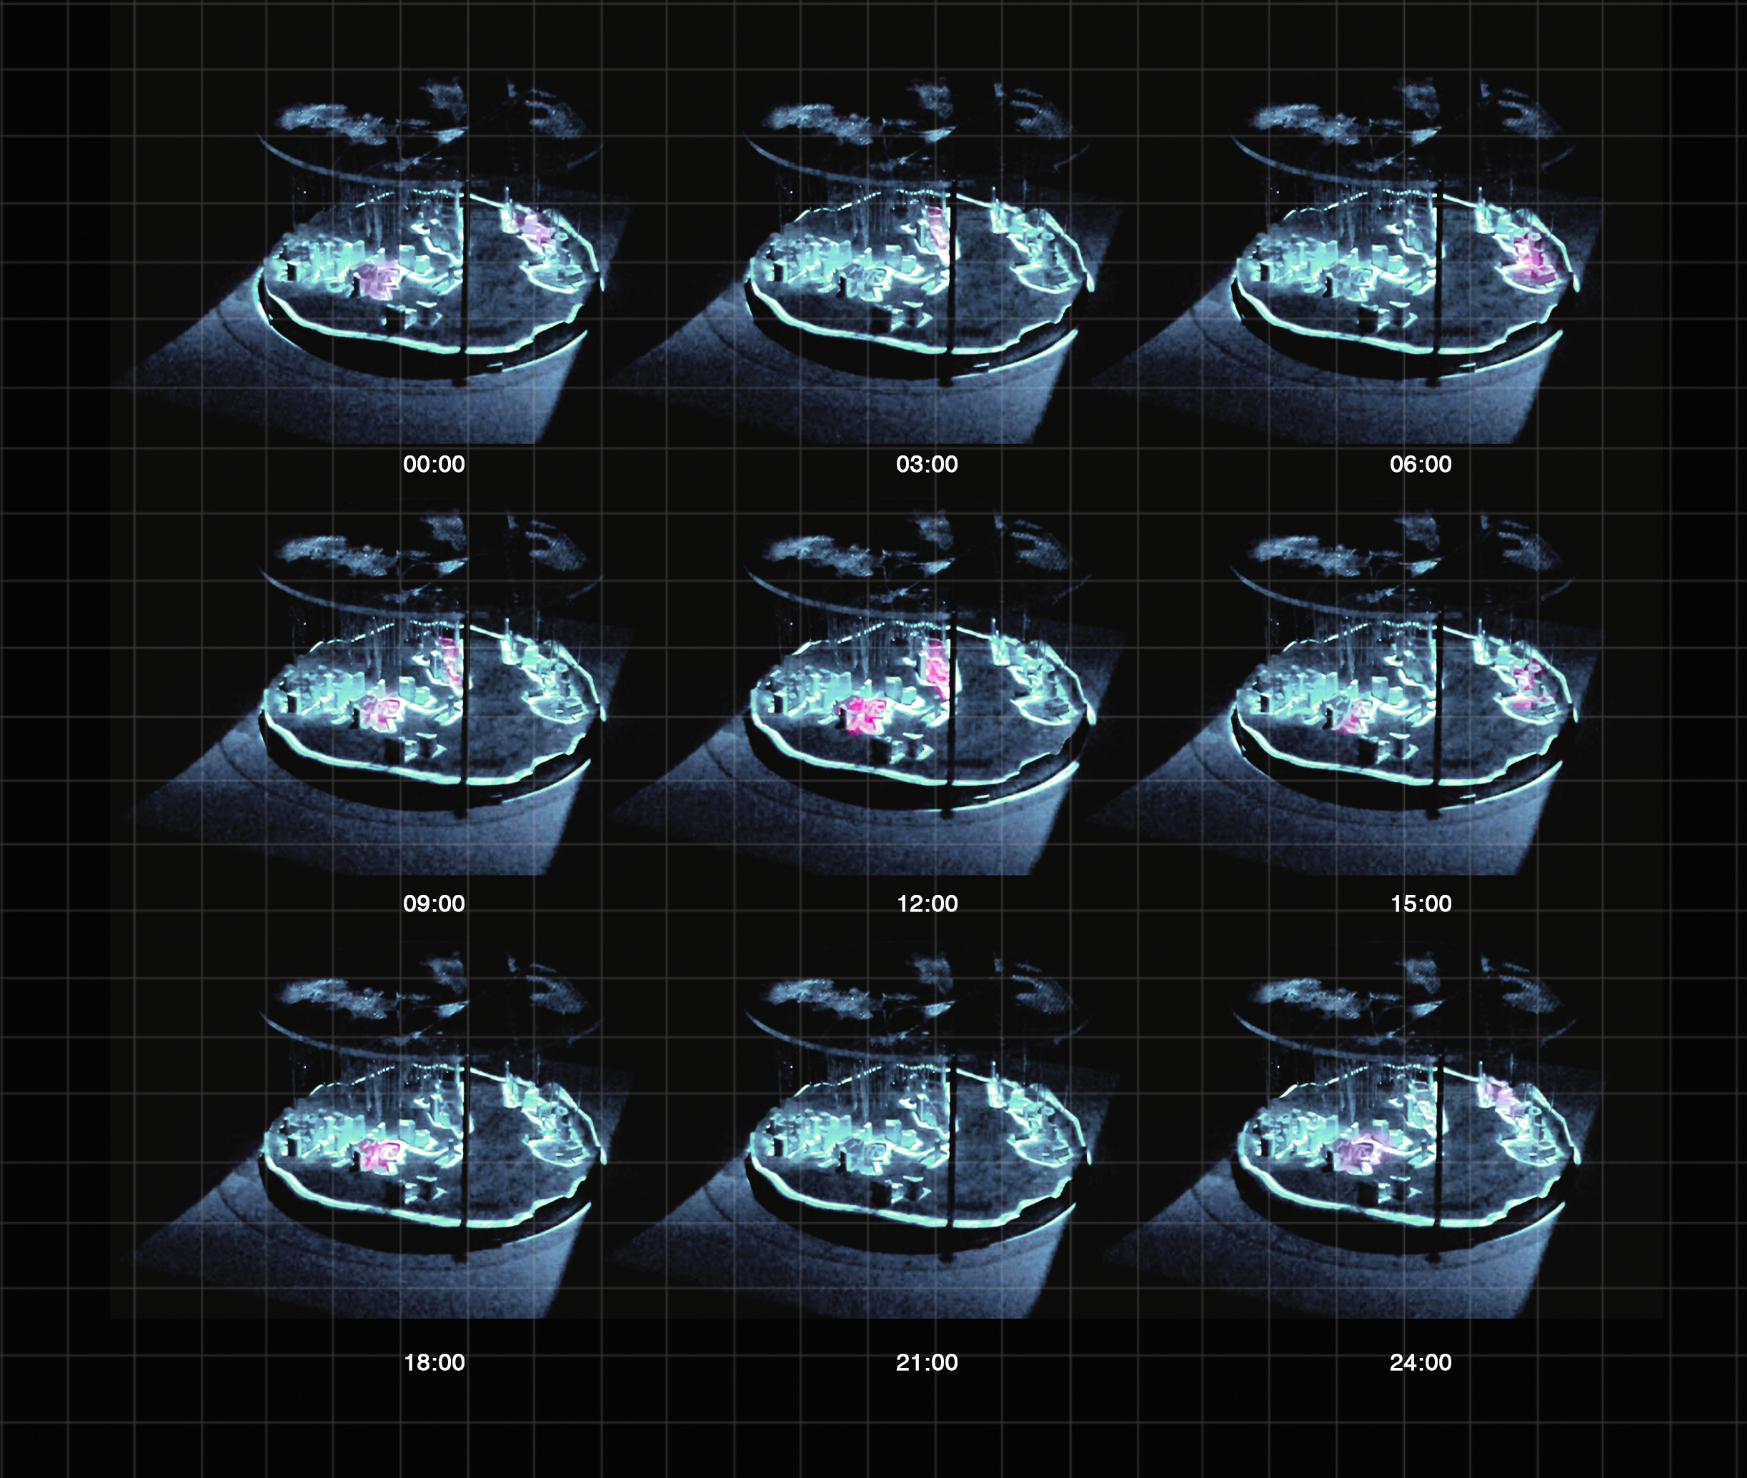
Vocality Over 24 Hours
The visualization shows vocality across different time periods of a day. Pink reflects the highest sound volume; cyan is relatively low.
By projecting these colors onto the physical model, the combination of color, material, and shape forms the complete "VOXSPACE" of the city.
This War
of Mine
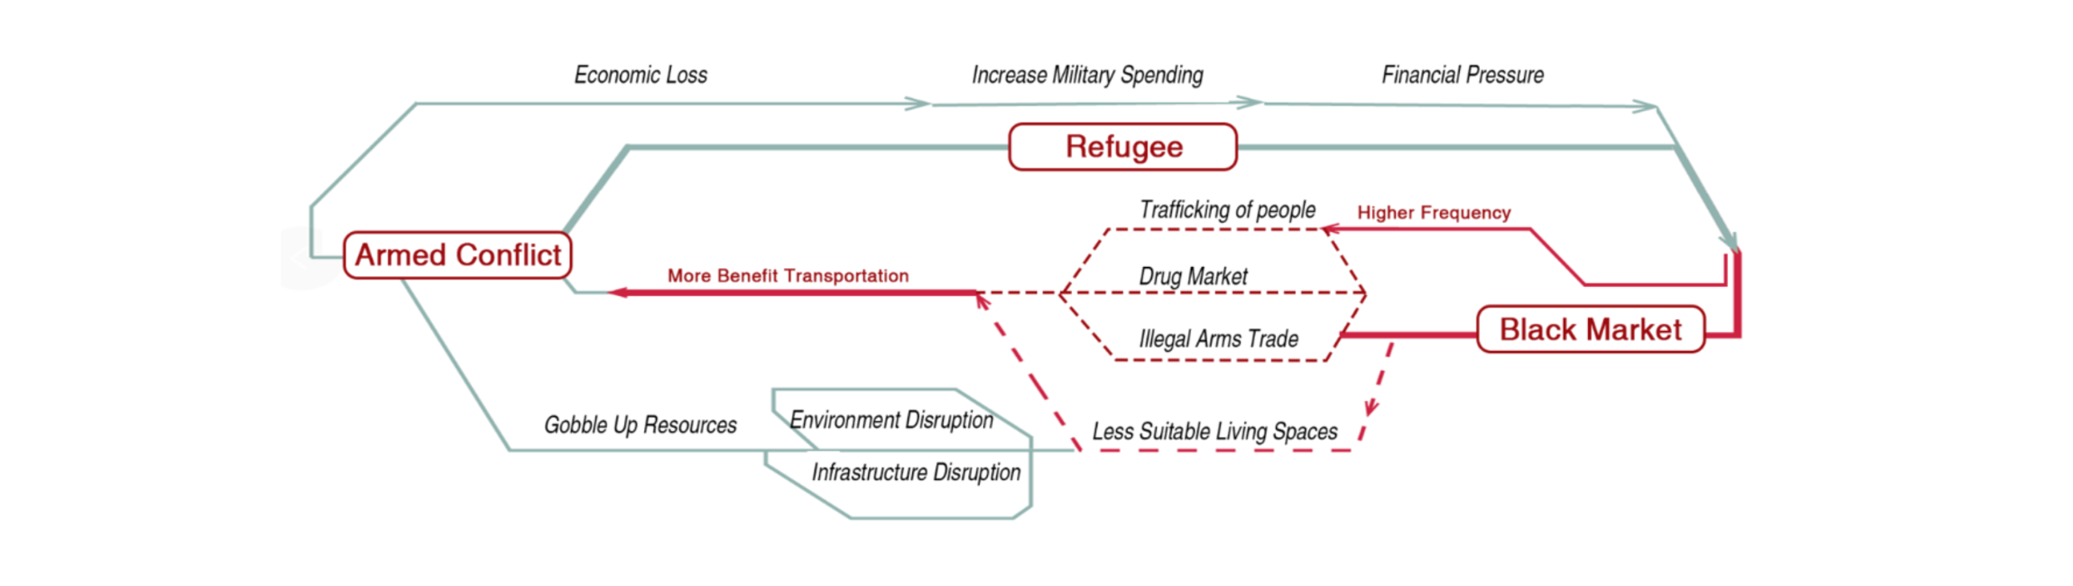
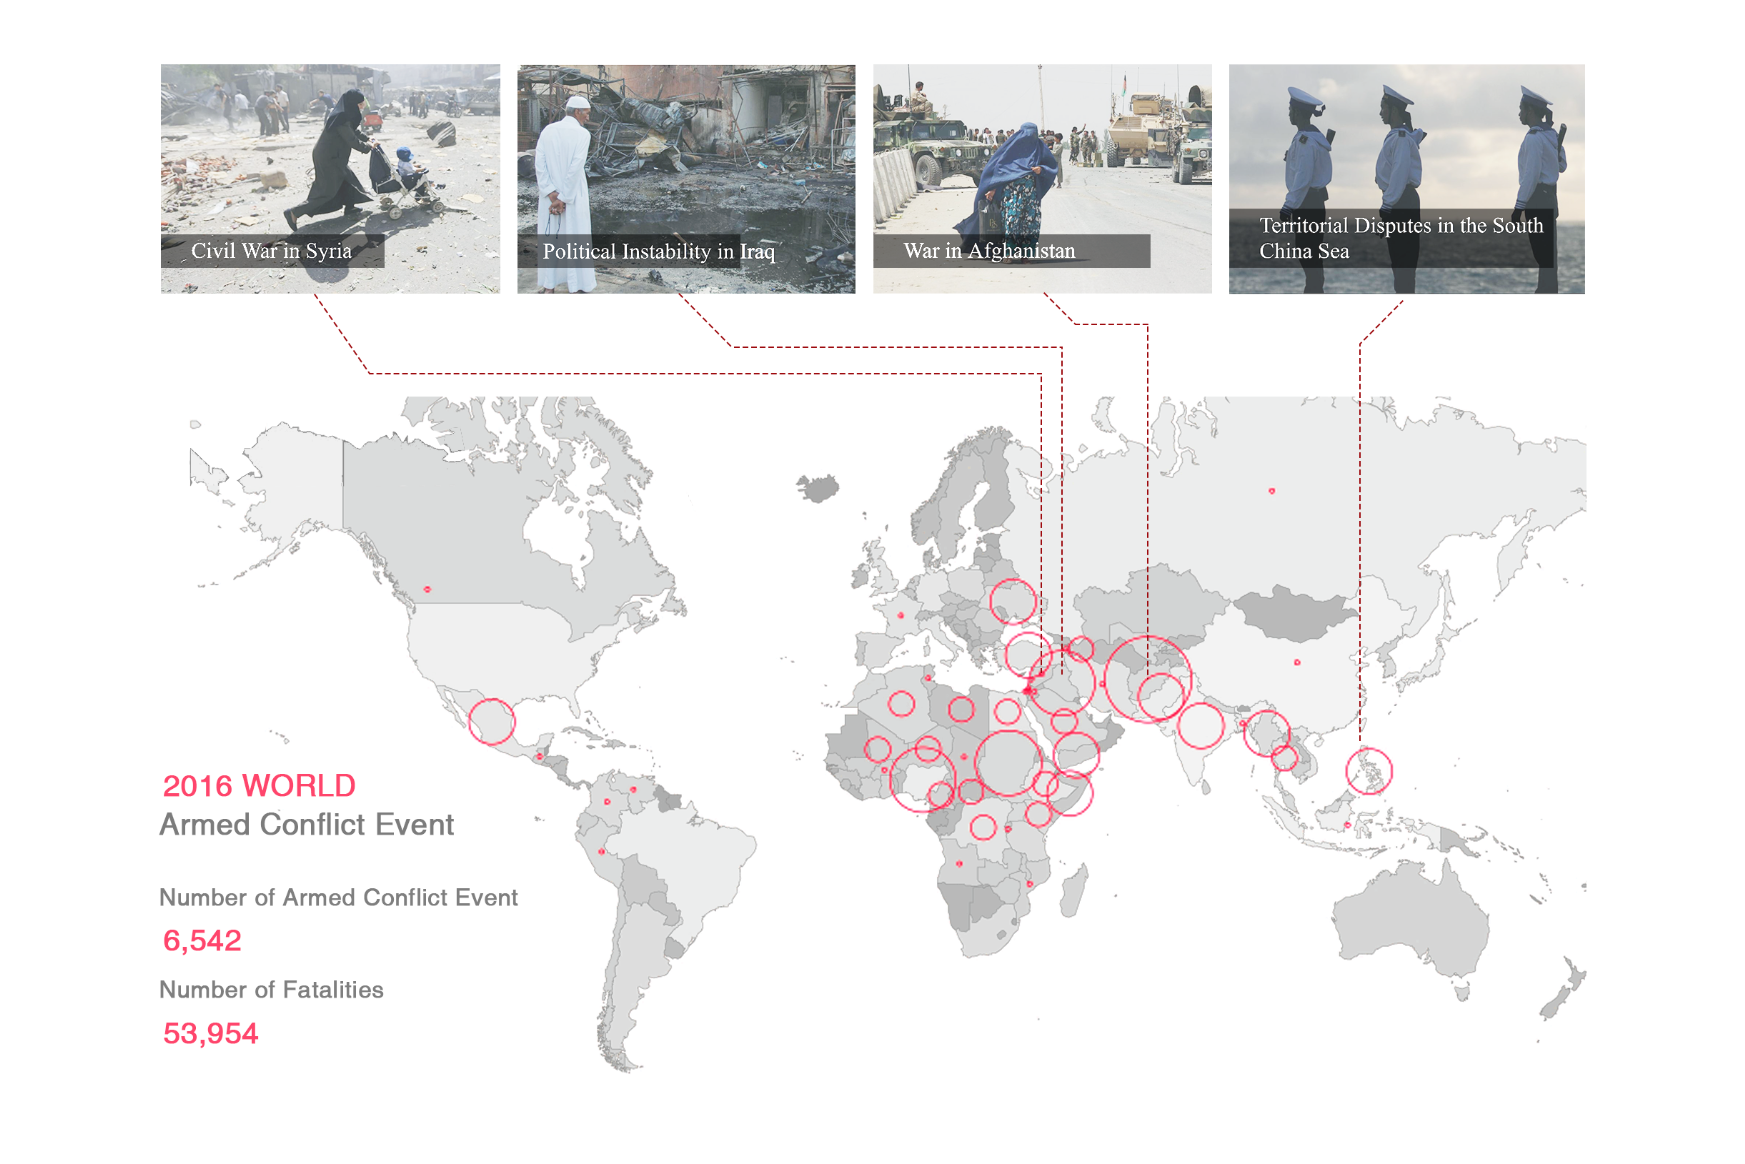
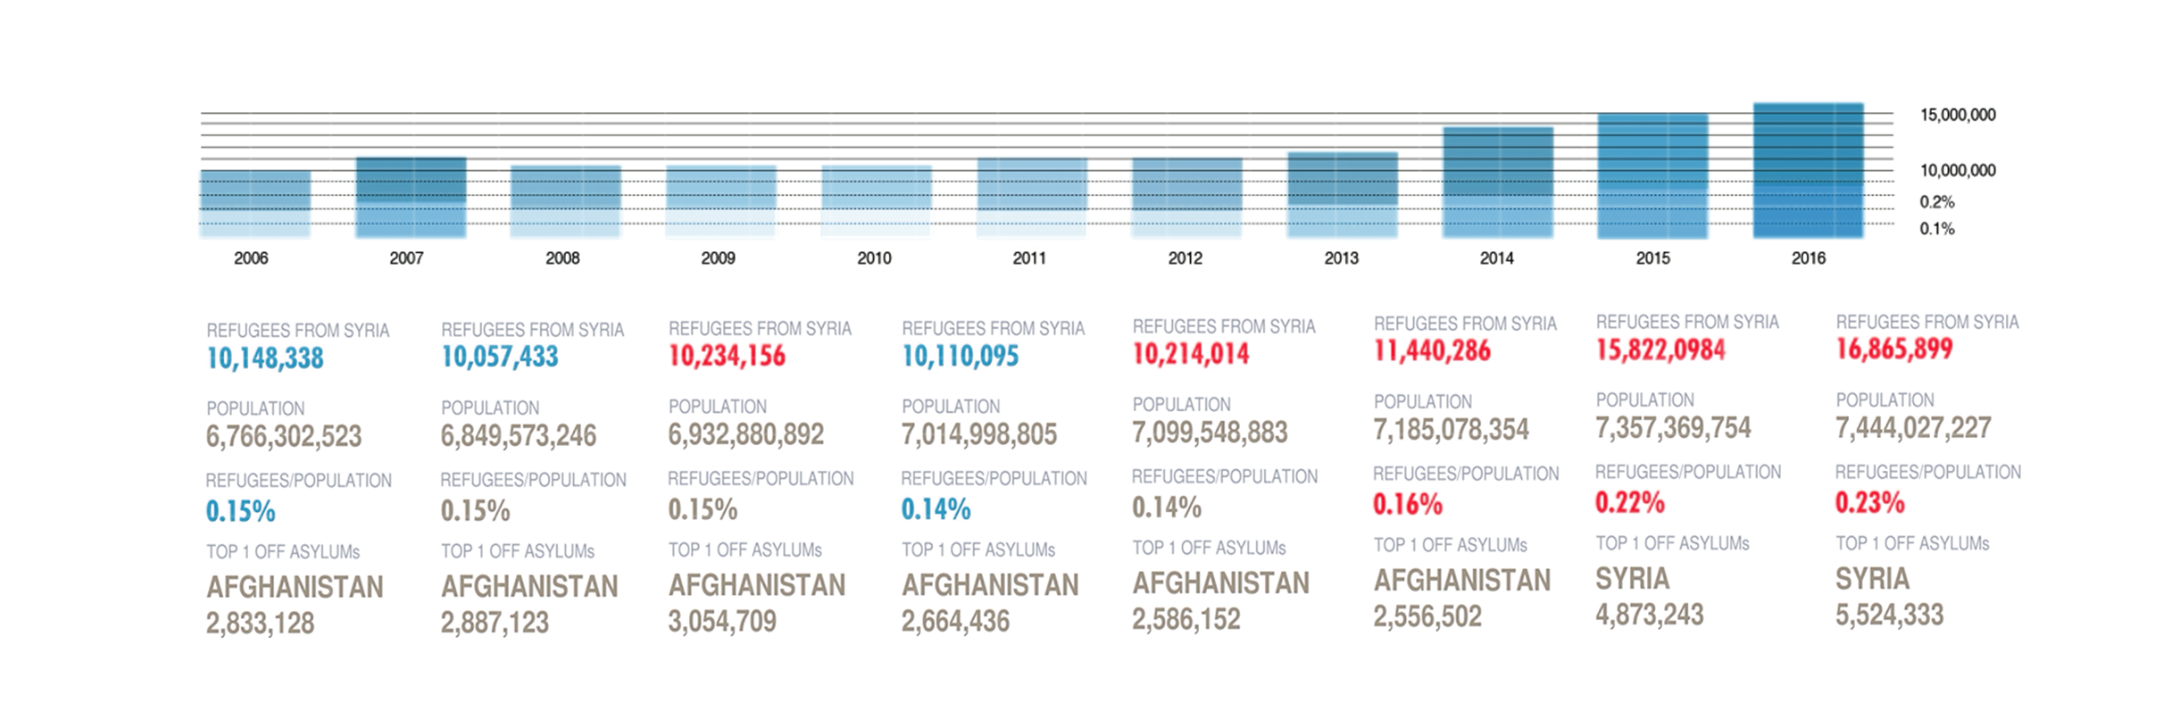
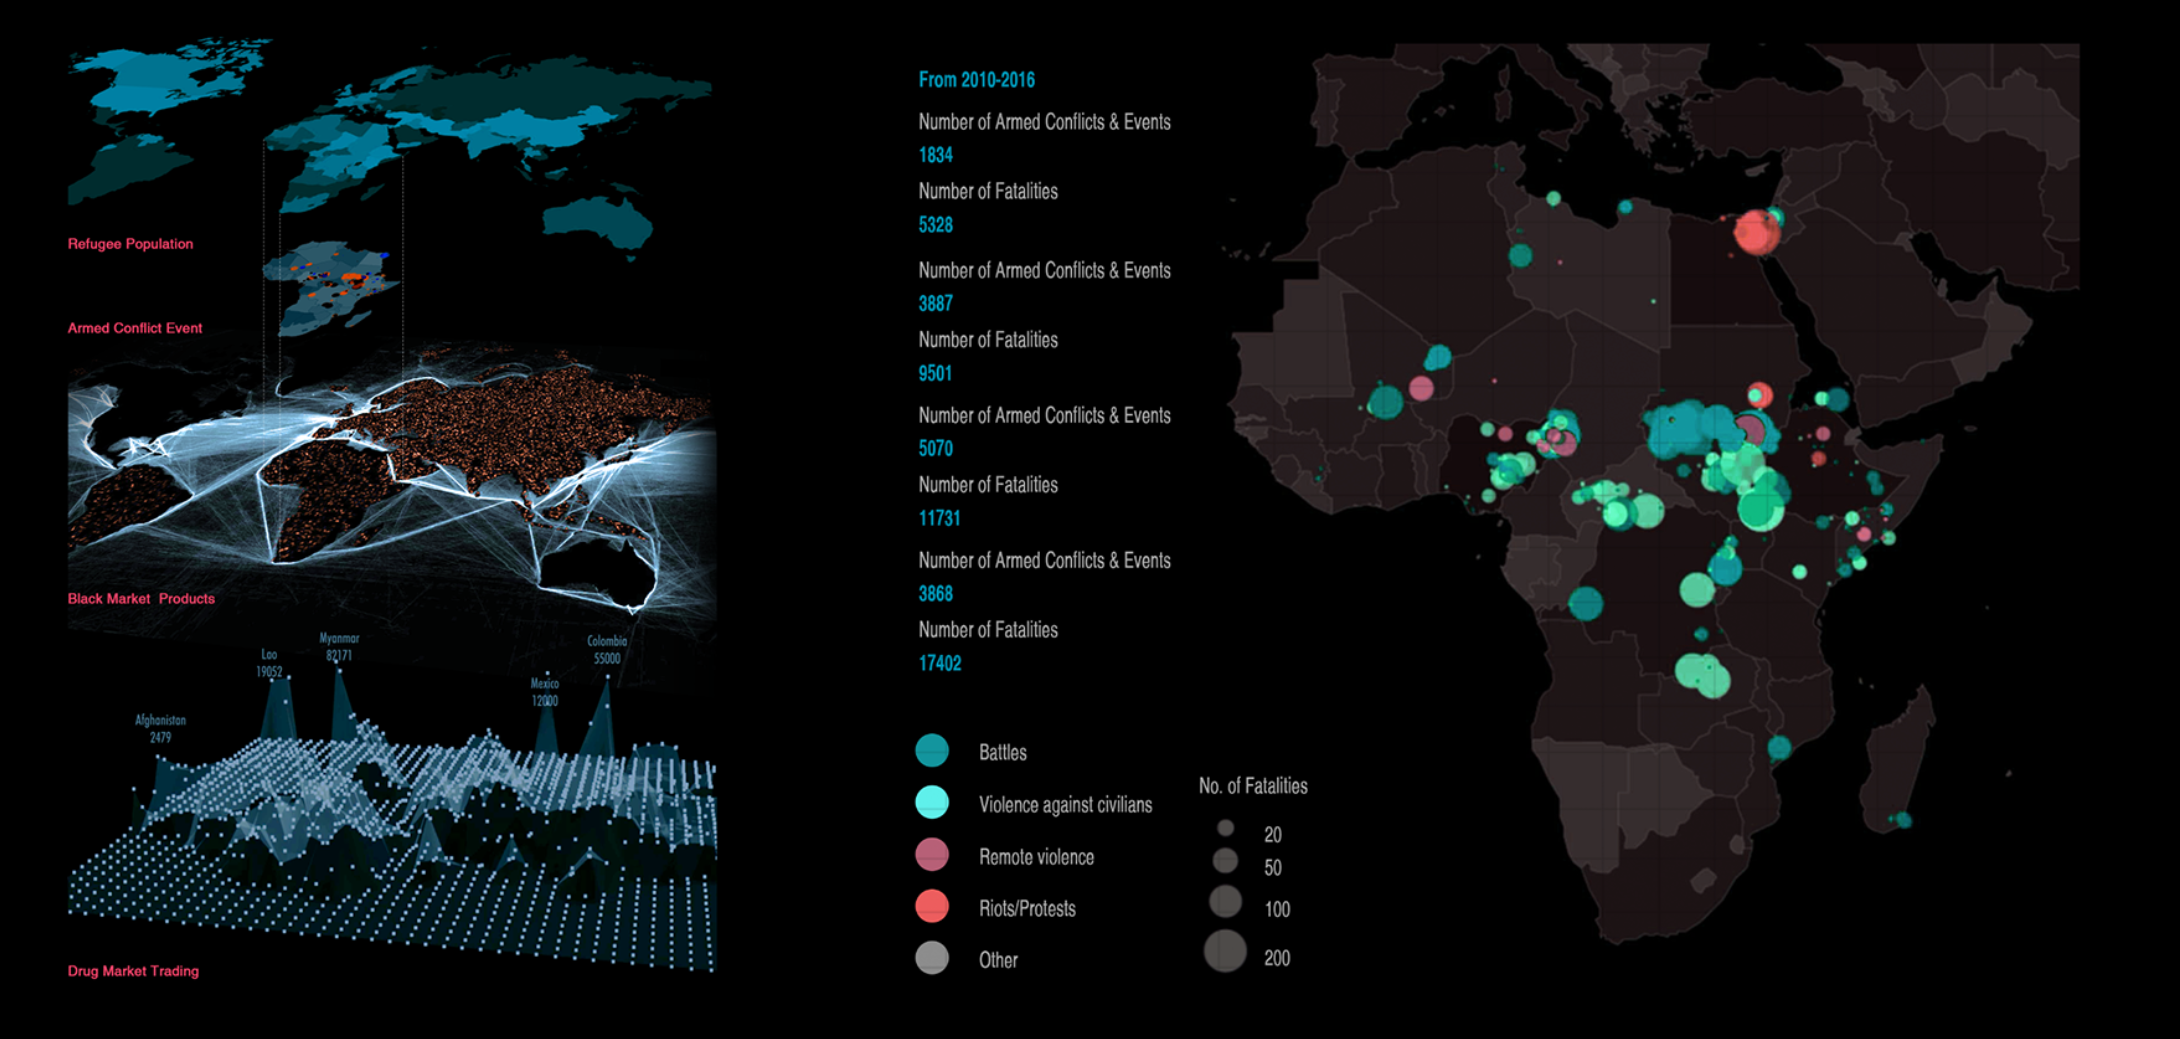
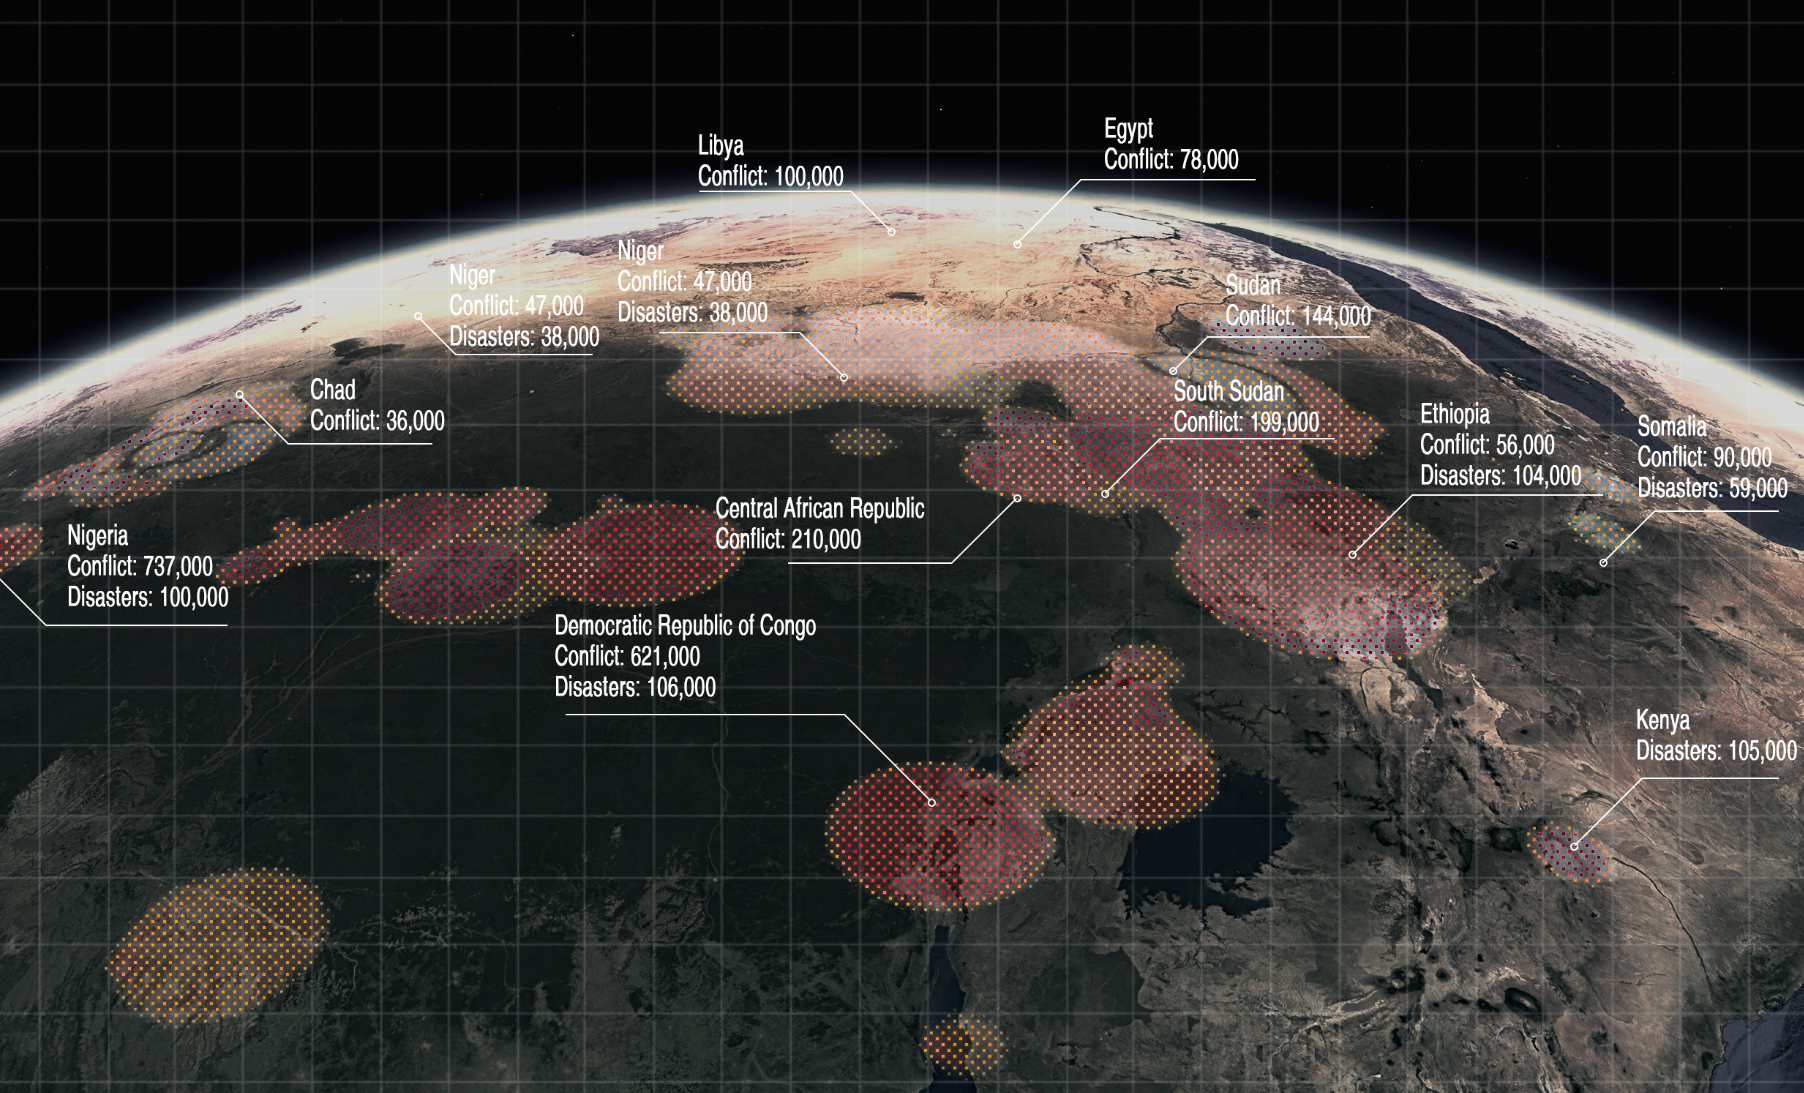
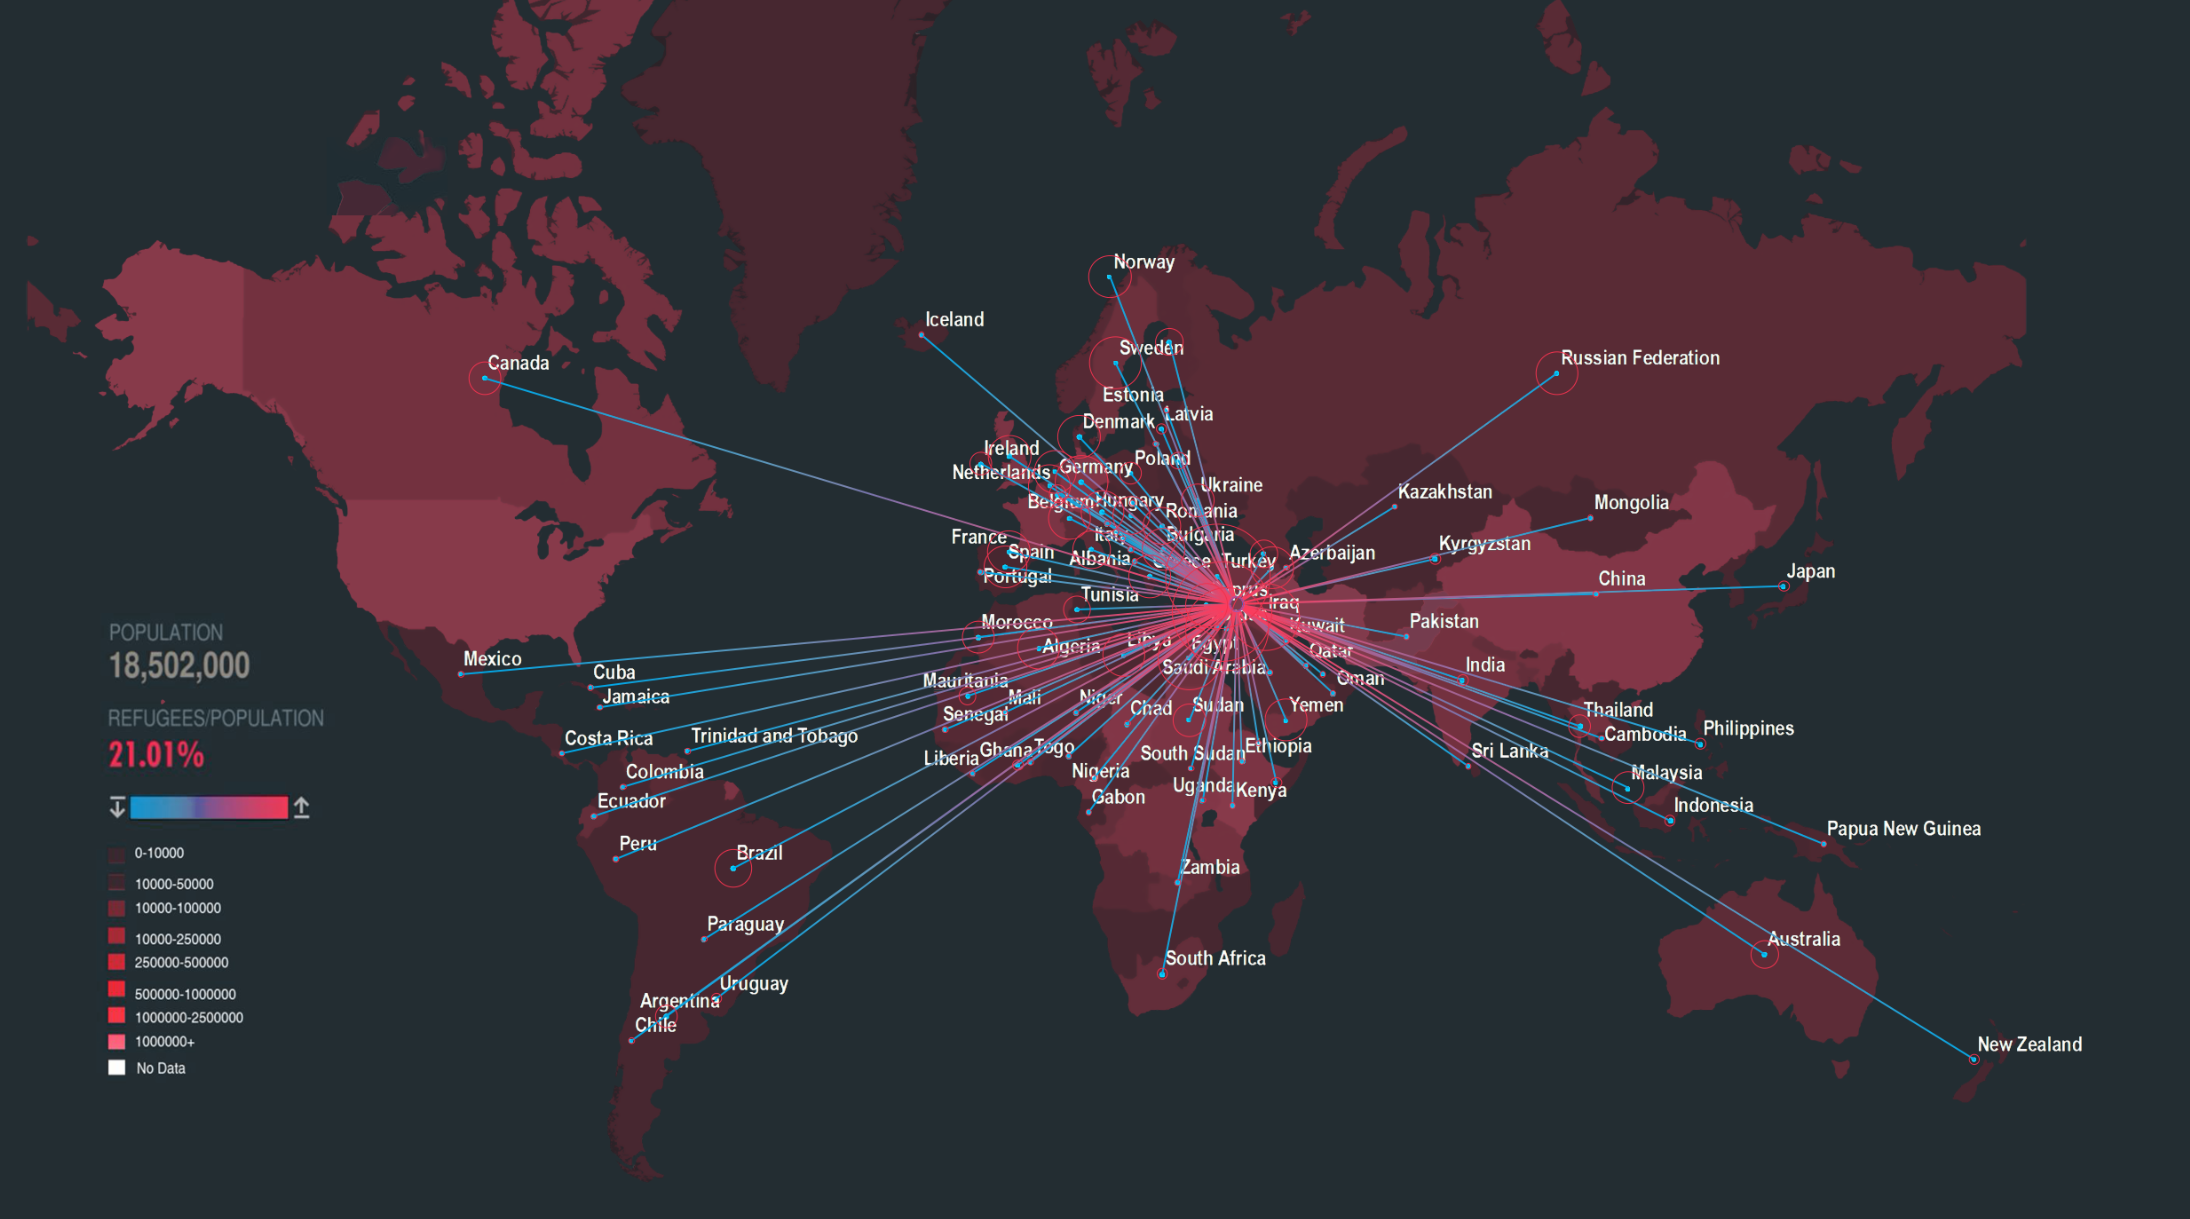
Starting from war worldwide, we track the flow of refugees and poverty situations, ending at the black market — to demonstrate that violence can only ever bring more violence.
In the 21st century, 32 active conflict zones span the globe. Innocent civilians remain the greatest victims — their displacement and exposure to black markets quantified across decades of armed conflict data.
"There never was a good war, or a bad peace."
— Benjamin Franklin